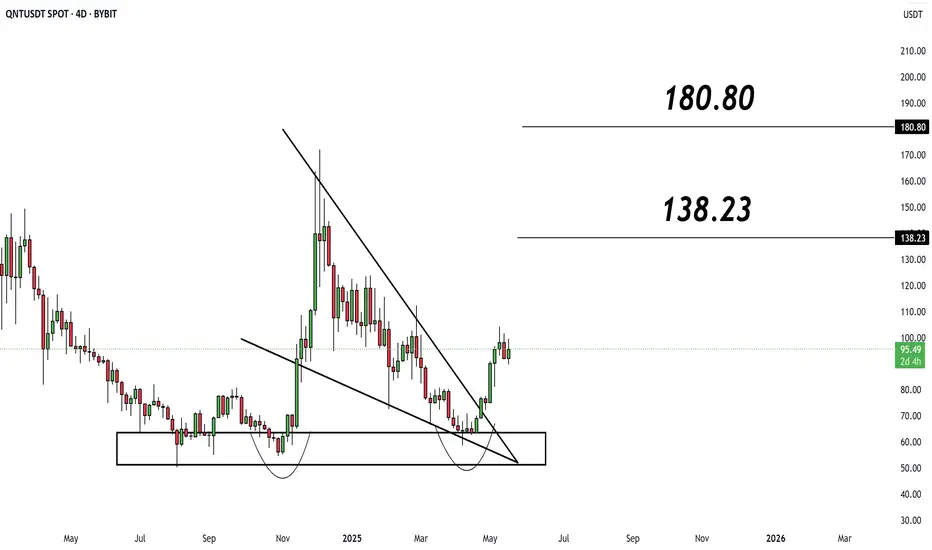
The chart shows a classic Double Bottom pattern formed within a strong support zone between $70–$80, followed by a bullish breakout from a Falling Wedge – a reliable reversal pattern.
✅ Technical Highlights:
✅ Falling Wedge Breakout: A bullish breakout confirms momentum shift.
✅ Current Price: $94.51
✅ Strong Support Zone: $70–$80
✅ Clear upside targets are marked on the chart.
🎯 Potential Price Targets:
Target 1: $138.23
Target 2: $180.80
⚠️ Alternative Scenario:
If the price fails to hold above the $90–$94 range, we may see a retest of the $85–$80 area before any sustained upward movement.
💡 Conclusion:
QNT is showing strong reversal signals after a long accumulation phase. The breakout from the falling wedge pattern and reclaiming of key levels suggest a bullish momentum building toward higher targets. Holding above $90 is crucial for continuation.
Subscribe to my Telegram Channel 👉 :
t.me/addlist/y5mi70s3c0Y3MDQ0
Subscribe to my X 👉 : x.com/VIPROSETR
t.me/addlist/y5mi70s3c0Y3MDQ0
Subscribe to my X 👉 : x.com/VIPROSETR
Disclaimer
The information and publications are not meant to be, and do not constitute, financial, investment, trading, or other types of advice or recommendations supplied or endorsed by TradingView. Read more in the Terms of Use.