*** ***
For this particular analysis on QUANT we are using the QNTUSDT symbol on the KuCoin exchange.
*** ***
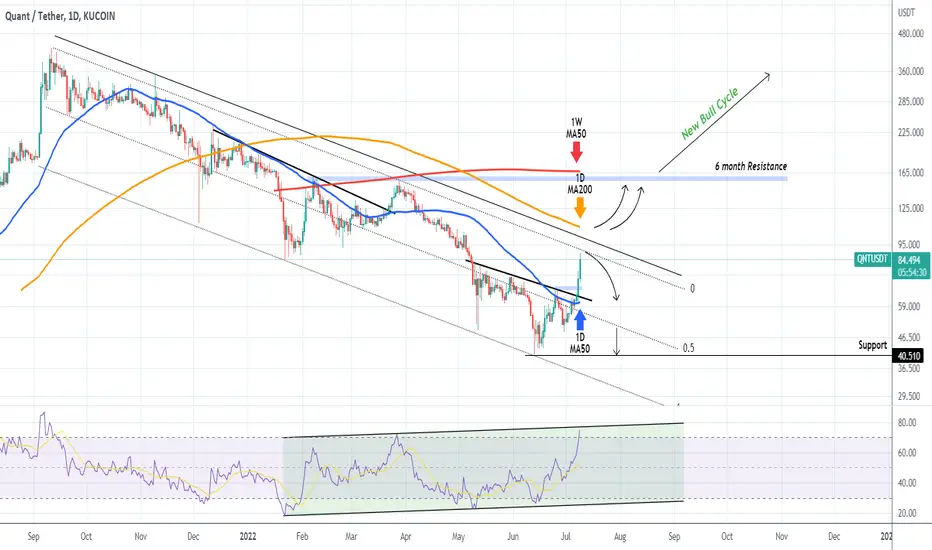
The idea is on the 1D time-frame where QUANT has posted a 10 day rally since the June 30 low, having broken above the 1D MA50 (blue trend-line). The long-term trend since the September 11 2021 High is a Channel Down and today the price almost hit the Lower Highs (top) zone of this pattern. This has had clear rejections on March 28 2022 and November 09 2021 previously.
In our opinion we need to see a clear break above the Lower Highs trend-line, preferably above the 1D MA200 (orange trend-line) even, in order to leave behind this long-term bearish trend. The bias should turn completely bullish long-term if the price breaks above the 160.500 6 month Resistance, which is where the 1W MA50 (red trend-line) roughly is (also a Resistance since Feb 10). Until then, selling on a tight Lower High SL towards the 1D MA50 is a viable strategy.
It is worth noting though that the market is close to a long-term bottom as the 1D RSI has staged a Bullish Divergence, being on Higher Lows and Higher Highs since January 22.
--------------------------------------------------------------------------------------------------------
Please like, subscribe and share your ideas and charts with the community!
--------------------------------------------------------------------------------------------------------
For this particular analysis on QUANT we are using the QNTUSDT symbol on the KuCoin exchange.
*** ***
The idea is on the 1D time-frame where QUANT has posted a 10 day rally since the June 30 low, having broken above the 1D MA50 (blue trend-line). The long-term trend since the September 11 2021 High is a Channel Down and today the price almost hit the Lower Highs (top) zone of this pattern. This has had clear rejections on March 28 2022 and November 09 2021 previously.
In our opinion we need to see a clear break above the Lower Highs trend-line, preferably above the 1D MA200 (orange trend-line) even, in order to leave behind this long-term bearish trend. The bias should turn completely bullish long-term if the price breaks above the 160.500 6 month Resistance, which is where the 1W MA50 (red trend-line) roughly is (also a Resistance since Feb 10). Until then, selling on a tight Lower High SL towards the 1D MA50 is a viable strategy.
It is worth noting though that the market is close to a long-term bottom as the 1D RSI has staged a Bullish Divergence, being on Higher Lows and Higher Highs since January 22.
--------------------------------------------------------------------------------------------------------
Please like, subscribe and share your ideas and charts with the community!
--------------------------------------------------------------------------------------------------------
👑Best Signals (Forex/Crypto+70% accuracy) & Account Management (+20% profit/month on 10k accounts)
💰Free Channel t.me/tradingshotglobal
🤵Contact info@tradingshot.com t.me/tradingshot
🔥New service: next X100 crypto GEMS!
💰Free Channel t.me/tradingshotglobal
🤵Contact info@tradingshot.com t.me/tradingshot
🔥New service: next X100 crypto GEMS!
Disclaimer
The information and publications are not meant to be, and do not constitute, financial, investment, trading, or other types of advice or recommendations supplied or endorsed by TradingView. Read more in the Terms of Use.