Positional setup for Quality Power Electrical Equipments Ltd. (Q
Technical Analysis (Daily Chart)
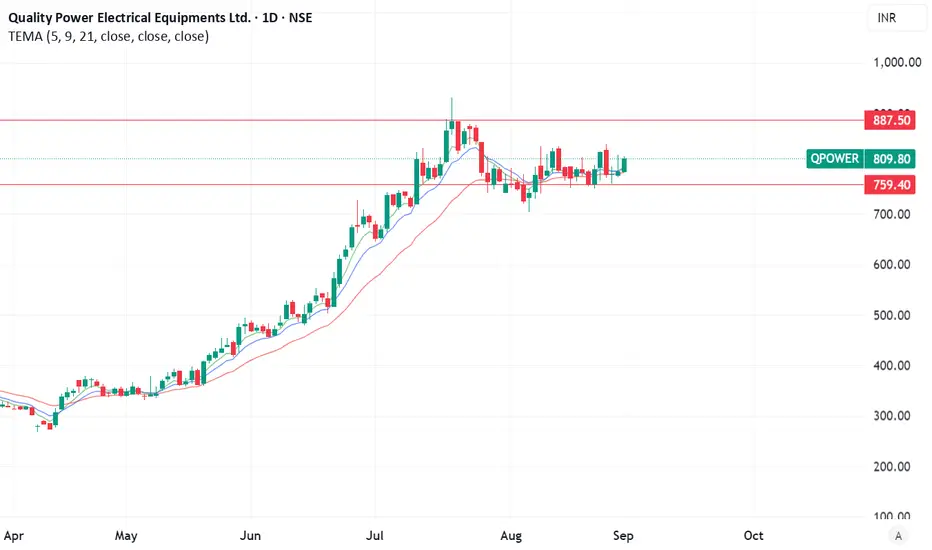
Trend Structure: The stock is riding a steady uptrend, with price comfortably above the 5-, 9-, and 21-period EMAs—signaling robust momentum.
Consolidation Base: A plateau formed around ₹780–820, anchoring a clear base from which a potential breakout may emerge.
Key Levels:
Entry: Buy near breakout above ₹820–825 with confirmation (volume and candle).
Support Zone: ₹790–800—acts as a protective buffer.
Target 1: ₹880–890 (recent swing high).
Target 2: ₹950+ if momentum sustains post-breakout.
Fundamentals Overview
Sourced from Screener, SimplyWall, StockAnalysis, ICICI Direct, and others:
Valuation & Returns:
P/E ≈ 91× — high vs industry average (~44×)
P/B ≈ 13×–14×
ROE ≈ 42%, ROCE ≈ 41–42%
Screener
Value Research Online
ICICI Direct
Profitability & Cash:
Recent quarterly revenues up to ₹177 Cr; net profits ~₹37 Cr
Screener
Sharescart
Profit margins strong: Gross ~38%, Operating ~15%, Net ~13%
StockAnalysis
Net cash position: ₹244 Cr cash vs ₹9 Cr debt → Net cash ~₹235 Cr (≈ ₹30/share)
StockAnalysis
Growth & Balance Sheet:
1-Year Sales & PAT CAGRs: ~19% & 38% respectively
Sharescart
Value Research Online
Market cap ~₹6,000 Cr; low gearing (~0.2–0.25) levered for strength
Screener
Value Research Online
Sharescart
StockAnalysis
Summary Table
Parameter Details
Entry Zone ₹820–825 (on strong breakout)
Stop-Loss ₹790–800 (below consolidation support)
Target Levels ₹880–890 → ₹950+
Valuation P/E ~91×, P/B ~13× → expensive territory
Profitability ROE ~42%, ROCE ~42%
Cash Position Strong net cash (~₹235 Cr)
Growth Strong recent growth; track record
Disclaimer
The information and publications are not meant to be, and do not constitute, financial, investment, trading, or other types of advice or recommendations supplied or endorsed by TradingView. Read more in the Terms of Use.
Disclaimer
The information and publications are not meant to be, and do not constitute, financial, investment, trading, or other types of advice or recommendations supplied or endorsed by TradingView. Read more in the Terms of Use.