🔎 Detailed Technical Analysis
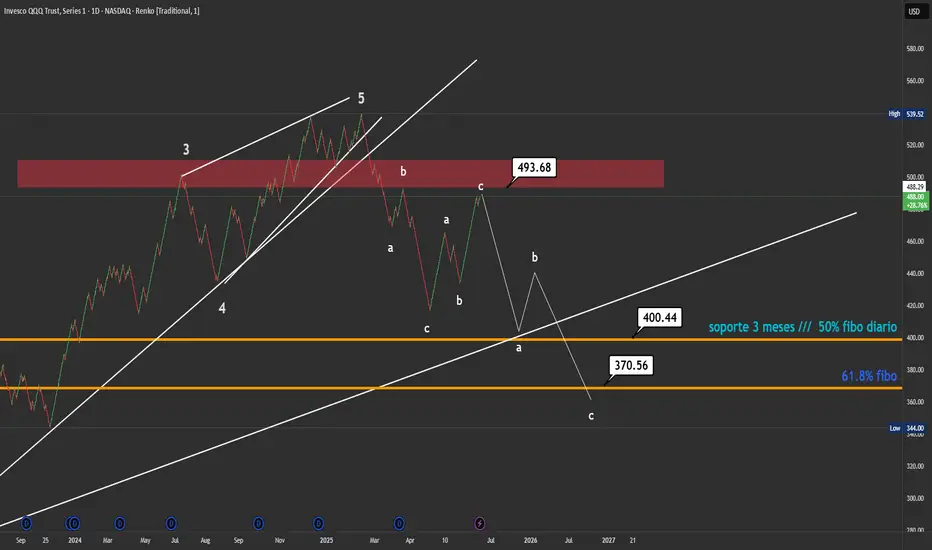
This chart displays a full 5-wave impulsive Elliott structure ending in an expanding wedge, a classic sign of exhaustion. After peaking near $493, the price broke the primary bullish channel and began a significant ABC corrective wave.
🧱 Why Renko? Filter Out the Noise
Renko charts remove candle noise and highlight pure price movement, making it easier to identify major structures and key levels with precision.
📉 Corrective Structure and Forecast
✅ Wave 5 completed inside a strong resistance zone ($493.68).
🔻 Channel break confirms structural weakness and trend shift.
🔁 Currently forming a complex ABC correction, with wave B unfolding and wave C yet to develop.
📌 Key Support Zones to Watch
🟠 $400.44 – Confluence of a 3-month support zone + 50% daily Fibonacci retracement.
🔵 $370.56 – The 61.8% Fibonacci level, a high-probability target for the end of wave C.
Both areas are prime for potential institutional buying and trend reversal.
🎯 Technical Outlook
Price action suggests the bearish bias remains until the corrective structure completes. The $370–$400 range could provide a high-quality long entry opportunity if a bullish reversal confirms.
🧭 Action Plan (Not Financial Advice)
Watch for failure near $493 to reinforce bearish setup.
Monitor volume and structure near $400 / $370.
Reversal patterns in this zone could trigger a new impulsive leg up.
📣 What’s your take?
Are we still inside wave B, or has wave C already started?
Disclaimer
The information and publications are not meant to be, and do not constitute, financial, investment, trading, or other types of advice or recommendations supplied or endorsed by TradingView. Read more in the Terms of Use.
Disclaimer
The information and publications are not meant to be, and do not constitute, financial, investment, trading, or other types of advice or recommendations supplied or endorsed by TradingView. Read more in the Terms of Use.