I failed to update my trade journal at the end of last week and am going to try to be better about it this week. I am going to try to keep these posts more brief so I can remain consistent and meet my goal of creating an accurate timeline of my trades. For this week, I am going in with a bullish bias, which is better supported on the PA for  QQQ instead of
  SPY , so I will be trading it instead.
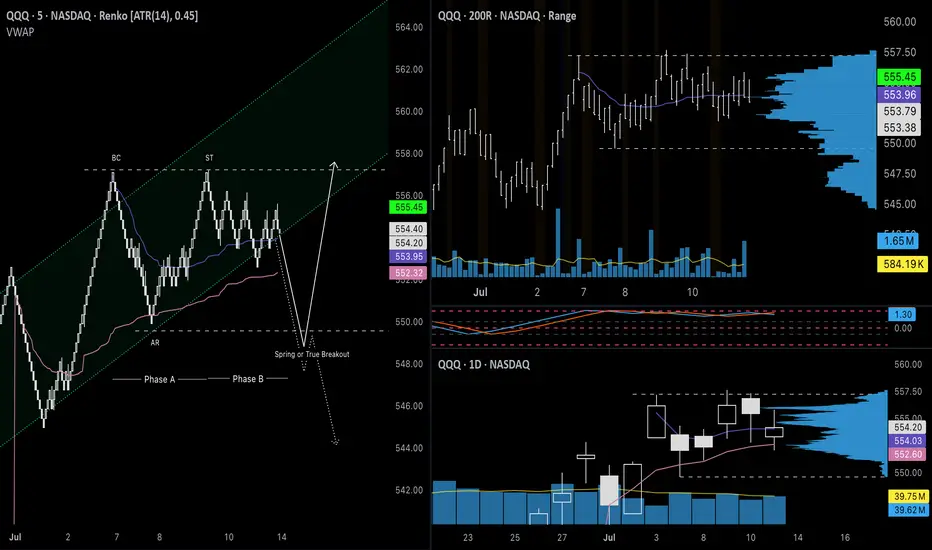
The price is currently down 0.60% overnight, which would take the price near the bottom of the range ($550), which is outside of the channel. In this flat structure, we will either see the price break up after a liquidity test (spring) or break down in a true bearish reversal.
+++++++++++++++++++++++++++
Neutral Analysis

Renko: As my main chart, Renko clearly shows both scenarios, illustrated by the solid white (bullish) line and the dotted (bearish) line. For the bullish idea, the price will find a significant number of buyers after a false breakout to the downside. I switched from Traditional box sizes to ATR (14) filtered, and as you can see, the automatic rally (AR) after the peak did not have a significant retracement. We did not see a retest of the upper part of the range that could be considered a secondary test (ST) until some time later and when it did, the price rose back to the peak, indicating that buyers still had strength. From there, the price has been chopping around in Phase B without making much progress to the downside, which it will most likely reach on Monday in the form of a gap down. Additionally, the rising channel that led to this pullback is also a strong pattern, so this pullback should be treated as possible re-accumulation. If the price fails to reenter the channel or reach the top after a breakout below the range, it will likely sell off from there.

200R Chart: The range chart also supports that the secondary test was the retest of the top of the channel, a potential sign of strength. The price is still way above the 200MA, so the uptrend appears strong. One important area to watch is the volume gap from $548-$549 on the volume profile. If bulls cannot defend the gap, that could be a potential sign of weakness.

500R Chart: I am including this chart because it does provide a reason to be cautious of a pullback, or even a reversal. The price is at the top of the channel that began on April 9th. The last time the price tested the upper boundary, it formed a temporary top and pulled back, which we could see play out again here. The volume candles also show significantly higher interest since May 13th. This could either be due to increased interest from buyers or the distribution of shares, requiring more effort to move the price higher.

Daily Chart: Here is another chart that suggests that the first movement that could be considered a secondary test was the retest of the top of the range. The price has been bouncing off monthly VWAP and Fisher Transform remains flat in the upper zone. We have not seen a bearish candle with intent on the daily chart. These have all been flat doji candles.

Options: For this section, I can’t provide a good analysis of on-the-money options since the price is likely to gap down. I’m including 7/15 $550p since the price will likely open around that level and will need to move below the strike to see the premium rise significantly. The price of this contract was in a larger descending channel and will need a strong break above the top ($2.15) in order to signal further downside for $QQQ. According to my options calculator, this would require the underlying price to drop below $551 for an extended period.
+++++++++++++++++++++++++++
Targets
Calls: Open at $549; Close at $557; Stop below $548
Puts: Open $550-$552; Close at $544.50; Stop above $555
The price is currently down 0.60% overnight, which would take the price near the bottom of the range ($550), which is outside of the channel. In this flat structure, we will either see the price break up after a liquidity test (spring) or break down in a true bearish reversal.
+++++++++++++++++++++++++++
Neutral Analysis
Renko: As my main chart, Renko clearly shows both scenarios, illustrated by the solid white (bullish) line and the dotted (bearish) line. For the bullish idea, the price will find a significant number of buyers after a false breakout to the downside. I switched from Traditional box sizes to ATR (14) filtered, and as you can see, the automatic rally (AR) after the peak did not have a significant retracement. We did not see a retest of the upper part of the range that could be considered a secondary test (ST) until some time later and when it did, the price rose back to the peak, indicating that buyers still had strength. From there, the price has been chopping around in Phase B without making much progress to the downside, which it will most likely reach on Monday in the form of a gap down. Additionally, the rising channel that led to this pullback is also a strong pattern, so this pullback should be treated as possible re-accumulation. If the price fails to reenter the channel or reach the top after a breakout below the range, it will likely sell off from there.
200R Chart: The range chart also supports that the secondary test was the retest of the top of the channel, a potential sign of strength. The price is still way above the 200MA, so the uptrend appears strong. One important area to watch is the volume gap from $548-$549 on the volume profile. If bulls cannot defend the gap, that could be a potential sign of weakness.
500R Chart: I am including this chart because it does provide a reason to be cautious of a pullback, or even a reversal. The price is at the top of the channel that began on April 9th. The last time the price tested the upper boundary, it formed a temporary top and pulled back, which we could see play out again here. The volume candles also show significantly higher interest since May 13th. This could either be due to increased interest from buyers or the distribution of shares, requiring more effort to move the price higher.
Daily Chart: Here is another chart that suggests that the first movement that could be considered a secondary test was the retest of the top of the range. The price has been bouncing off monthly VWAP and Fisher Transform remains flat in the upper zone. We have not seen a bearish candle with intent on the daily chart. These have all been flat doji candles.
Options: For this section, I can’t provide a good analysis of on-the-money options since the price is likely to gap down. I’m including 7/15 $550p since the price will likely open around that level and will need to move below the strike to see the premium rise significantly. The price of this contract was in a larger descending channel and will need a strong break above the top ($2.15) in order to signal further downside for $QQQ. According to my options calculator, this would require the underlying price to drop below $551 for an extended period.
+++++++++++++++++++++++++++
Targets
Calls: Open at $549; Close at $557; Stop below $548
Puts: Open $550-$552; Close at $544.50; Stop above $555
Trade closed manually
I missed the biggest move of the day due to the fact that I was waiting for the underlying price on
I wasn’t watching the call option chart in real time at the opening bell, but had I watched the downward channel boundaries, I could have entered after the bounce off support (~$1.10), which would have given me a maximum profit opportunity of up to 200%. I’d like to see a bullish continuation tomorrow that would build on this call breakout. If the market opens higher, I may be inclined to enter calls at the bell. On to the next one.
Disclaimer
The information and publications are not meant to be, and do not constitute, financial, investment, trading, or other types of advice or recommendations supplied or endorsed by TradingView. Read more in the Terms of Use.
Disclaimer
The information and publications are not meant to be, and do not constitute, financial, investment, trading, or other types of advice or recommendations supplied or endorsed by TradingView. Read more in the Terms of Use.