QQQ Technical and Options Flow Analysis
Timeframe: 15-minute chart
Source: SpotGamma Levels & Custom Volume Profile Zones
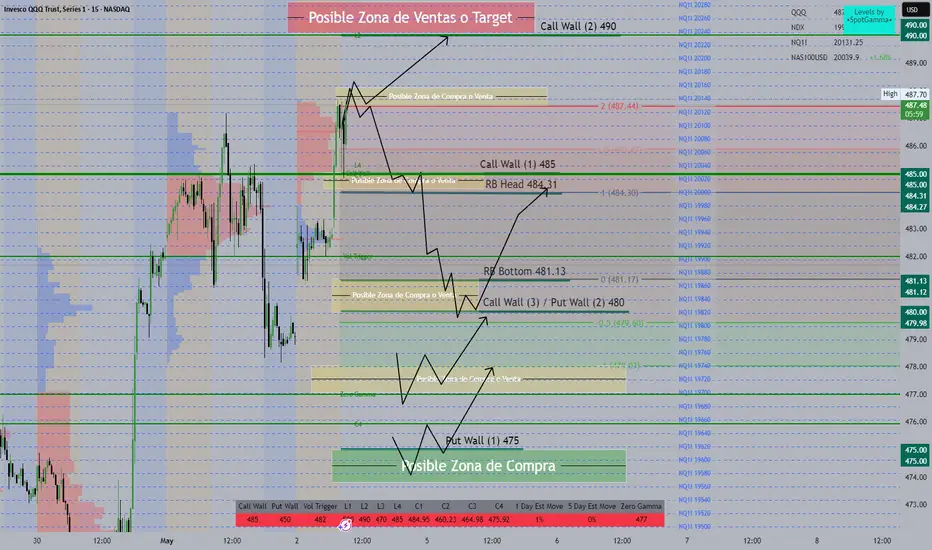
🔺 Key Resistance Levels (Potential Sell/Target Zones):
Zone Price Remarks
Call Wall (2) 490.00 Major resistance — target area for calls
High of May 2nd 487.44 Short-term intraday resistance
Call Wall (1) 485.00 Intermediate resistance and sell zone
RB Head 484.31 Breakdown area — if rejected, expect downside
🔻 Key Support Levels (Potential Buy Zones):
Zone Price Remarks
Call Wall (3) / Put Wall (2) 480.00 Key pivot zone — watch for defense or breakdown
RB Bottom 481.13 Breakdown support from prior rejection zone
Put Wall (1) 475.00 Strong put support — primary buying interest
Zero Gamma 477.00 Gamma pivot point — volatility may spike near it
Timeframe: 15-minute chart
Source: SpotGamma Levels & Custom Volume Profile Zones
🔺 Key Resistance Levels (Potential Sell/Target Zones):
Zone Price Remarks
Call Wall (2) 490.00 Major resistance — target area for calls
High of May 2nd 487.44 Short-term intraday resistance
Call Wall (1) 485.00 Intermediate resistance and sell zone
RB Head 484.31 Breakdown area — if rejected, expect downside
🔻 Key Support Levels (Potential Buy Zones):
Zone Price Remarks
Call Wall (3) / Put Wall (2) 480.00 Key pivot zone — watch for defense or breakdown
RB Bottom 481.13 Breakdown support from prior rejection zone
Put Wall (1) 475.00 Strong put support — primary buying interest
Zero Gamma 477.00 Gamma pivot point — volatility may spike near it
Disclaimer
The information and publications are not meant to be, and do not constitute, financial, investment, trading, or other types of advice or recommendations supplied or endorsed by TradingView. Read more in the Terms of Use.
Disclaimer
The information and publications are not meant to be, and do not constitute, financial, investment, trading, or other types of advice or recommendations supplied or endorsed by TradingView. Read more in the Terms of Use.