Included in this post are quant levels for:
1) QQQ
2) TSLA
3) ARKK
4) NVDA
5) Overall outlook of this Sector (looking at the data holistically)
Intro
SPY had some great movement this week and so it consisted of 98% of all my trades. I did 1 trade on TSLA, 1 trade on QQQ and 1 day trade on ARKK (a new stock I have added to my repertoire), thus I really feel out of touch with what is going on with the tech stocks. So this post is more for me to refamiliarize and update myself with where we currently stand in this area. Hopefully it will help you, too!
QQQ

Quick and dirty deets:
Monday Range: 357 - 365
Bullish Break: Over 364 with hold above 364.05
Bearish Break: Under 359 with hold below 359.44
Predicted Sentiment: Neutral with both bearish and bullish movement / expect a high over 362.81 and a low under 362.81.
(I am being very specific here with the cent value because I have noticed lately the market has been pushing stocks into my key ranges as fakeouts. Traditionally, I would just look at the round number, but I have noticed in the past 2 weeks, especially with TSLA, that the cents actually matter, which they never did before so this is new).
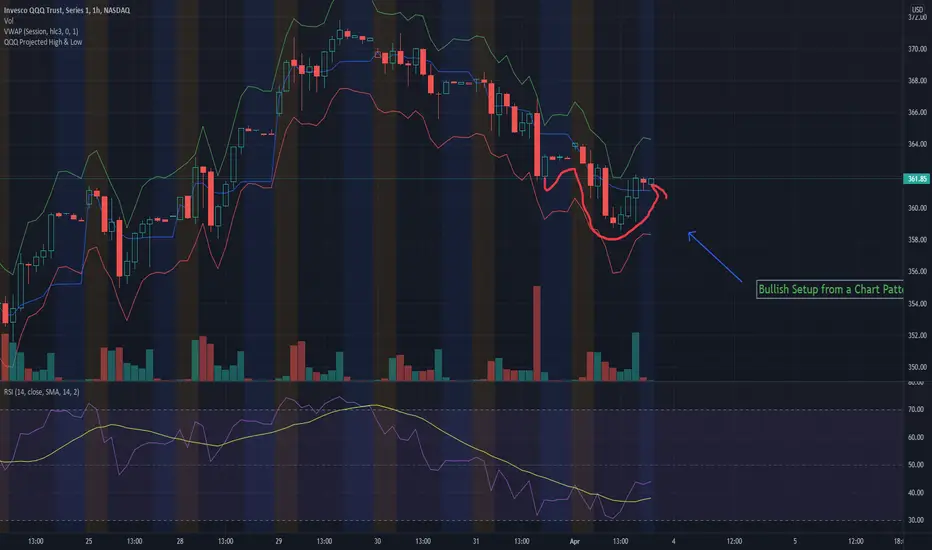
Based on where QQQ finished in after-hours trading, the next projected levels are displayed in the chart above based on my indicator. You will notice that it corresponds to my levels. Yes! Because those indicators are programmed with the same principles, slightly more simplistic, but still fairly effective!
We will be passing one of those levels on Monday. Not sure which one, but I am sure one will be surpassed.
Technical Standpoint
From a technical standpoint, and again, I am not a TA so please take this with a grain of salt, it really looks like we are poised for some upward movement. Looking at RSI and just the curving of the chart pattern, it looks like we could see some bullish continuation into Monday. Taking this with the data, I really would like to see that bullishness get halted at the 364 level or slightly before back down, to maintain this bearish sentiment. But the reality is, I could for see this exhibiting bullishness Monday, passing that 364 up to 365. I think the drop is coming, I just don't think its going to be happening Monday, and the math doesn't think it is either. I am not getting hugely bearish readings or signals from the chart or from the numbers being generated in the model. So, I mean, take that as you will!

TSLA

Jeeze, I missed out on this stock this week!
TSLA has had a recent sentiment change. I have updated my models and interpretations accordingly, as you will see the data presented a bit differently here (this is why).
Quick and dirty deets:
Monday range: 1058 - 1115
Bullish Target: Break over 1099.27, likely not to exceed 1115 unless there is a break over 1107.
Bearish Target: Break under 1075, likely not to drop below 1058 unless there is a break under 1066.
Sentiment: Neutral, maybe more on the bullish side. Expect a low of less than 1081.15 and a high of greater than 1081.15.
Technical Standpoint:
Well, the elephant in the room is that huge ass gap that TSLA created! (see chart above). Jeeze. So I guess there was a catalyst this week, it was TSLA's stock split. All these companies be splittin' stocks it seems.
So are we going to fill this gap? Yes, yes we will. But probably not Monday.
We have a nice bull flag on the daily on both TSLA and QQQ. We also have some overhead resistance that we haven't quite got to. So from a technical perspective, and this is actually kind of supported in the quant data, we can very well expect to see a break out from this bull flag towards that overhead resistance (see chart below).

We also have the catalyst, the stock split, but we also have earnings coming up. Lots going on in the TSLA world and I wouldn't be quick to gap chase lower gaps here.
ARKK

Trading Range: 63 - 67
High Range: 66 - 67
Low Range: 63 - 64
Sentiment : Likely more bullish than bearish, but expect a low of less than 66.77 and a high greater than 66.77.
Technical Standpoint:
It kind of looks like it is doing a double top on the daily chart. But on closer look, its doing that creepy Ronald Mcdonald smiling face thing which actually tends to be more of a bullish sign. Taking it in context with QQQ and TSLA data, yeah I think we could see some more upward momentum and movement here.
We have some underside support a few points down but no descending resistance like we have with TSLA.

NVDA

I don't know why, but I find NVDA such a boring stock, so I will keep this brief.
Monday Range: 260 - 274
Bullish price: Break over 272
Bearish price: break below 261
Sentiment: Interestingly, calculations think this is bearish. It thinks that it won't be able to make a high over 273.75. Sentiment calculations for NVDA, are hit and miss. I think the accuracy is around 75 to 80% on backtesting, but I don't ever trade NVDA so I can speak to real world applications of this data. I just have it for interest sake!
Technical Standpoint
Can be summarized with one word. Messy.
We have it currently in a downtrend. There is some overhead resistance. I think it may be aiming for the rocket ship type pattern (see below).

But overall, seems like its unsure of its next big move.
Summarizing
So, out of the 4 stocks included, 3 all predict a sentiment of good movement in both directions. None of the data is overwhelmingly bearish, its all fairly mellow. To put it in perspective, when SPY did that run to 415 approx 2 Mondays ago, the data was EXTREMELY convincingly bearish over the weekend and on futures open. I am not getting any of that currently.
SO I would expect a relatively unremarkable data on Monday. Just stocks doing their thing, minding their own business, etc. etc.
I would avoid NVDA though. It just seems the least convincing of all of them. But you obviously do you!
And I know SPY is not included here. As usual, I will post after the first 1 hour of futures data for SPY, as that first 1 hour really allows me to hone in my calculations and projections!
Thanks everyone! Enjoy the rest of your weekend! Keep it restful and, as always, be safe!
Let me know your comments, questions and criticisms below.
Not financial advice!
1) QQQ
2) TSLA
3) ARKK
4) NVDA
5) Overall outlook of this Sector (looking at the data holistically)
Intro
SPY had some great movement this week and so it consisted of 98% of all my trades. I did 1 trade on TSLA, 1 trade on QQQ and 1 day trade on ARKK (a new stock I have added to my repertoire), thus I really feel out of touch with what is going on with the tech stocks. So this post is more for me to refamiliarize and update myself with where we currently stand in this area. Hopefully it will help you, too!
QQQ
Quick and dirty deets:
Monday Range: 357 - 365
Bullish Break: Over 364 with hold above 364.05
Bearish Break: Under 359 with hold below 359.44
Predicted Sentiment: Neutral with both bearish and bullish movement / expect a high over 362.81 and a low under 362.81.
(I am being very specific here with the cent value because I have noticed lately the market has been pushing stocks into my key ranges as fakeouts. Traditionally, I would just look at the round number, but I have noticed in the past 2 weeks, especially with TSLA, that the cents actually matter, which they never did before so this is new).
Based on where QQQ finished in after-hours trading, the next projected levels are displayed in the chart above based on my indicator. You will notice that it corresponds to my levels. Yes! Because those indicators are programmed with the same principles, slightly more simplistic, but still fairly effective!
We will be passing one of those levels on Monday. Not sure which one, but I am sure one will be surpassed.
Technical Standpoint
From a technical standpoint, and again, I am not a TA so please take this with a grain of salt, it really looks like we are poised for some upward movement. Looking at RSI and just the curving of the chart pattern, it looks like we could see some bullish continuation into Monday. Taking this with the data, I really would like to see that bullishness get halted at the 364 level or slightly before back down, to maintain this bearish sentiment. But the reality is, I could for see this exhibiting bullishness Monday, passing that 364 up to 365. I think the drop is coming, I just don't think its going to be happening Monday, and the math doesn't think it is either. I am not getting hugely bearish readings or signals from the chart or from the numbers being generated in the model. So, I mean, take that as you will!
TSLA
Jeeze, I missed out on this stock this week!
TSLA has had a recent sentiment change. I have updated my models and interpretations accordingly, as you will see the data presented a bit differently here (this is why).
Quick and dirty deets:
Monday range: 1058 - 1115
Bullish Target: Break over 1099.27, likely not to exceed 1115 unless there is a break over 1107.
Bearish Target: Break under 1075, likely not to drop below 1058 unless there is a break under 1066.
Sentiment: Neutral, maybe more on the bullish side. Expect a low of less than 1081.15 and a high of greater than 1081.15.
Technical Standpoint:
Well, the elephant in the room is that huge ass gap that TSLA created! (see chart above). Jeeze. So I guess there was a catalyst this week, it was TSLA's stock split. All these companies be splittin' stocks it seems.
So are we going to fill this gap? Yes, yes we will. But probably not Monday.
We have a nice bull flag on the daily on both TSLA and QQQ. We also have some overhead resistance that we haven't quite got to. So from a technical perspective, and this is actually kind of supported in the quant data, we can very well expect to see a break out from this bull flag towards that overhead resistance (see chart below).
We also have the catalyst, the stock split, but we also have earnings coming up. Lots going on in the TSLA world and I wouldn't be quick to gap chase lower gaps here.
ARKK
Trading Range: 63 - 67
High Range: 66 - 67
Low Range: 63 - 64
Sentiment : Likely more bullish than bearish, but expect a low of less than 66.77 and a high greater than 66.77.
Technical Standpoint:
It kind of looks like it is doing a double top on the daily chart. But on closer look, its doing that creepy Ronald Mcdonald smiling face thing which actually tends to be more of a bullish sign. Taking it in context with QQQ and TSLA data, yeah I think we could see some more upward momentum and movement here.
We have some underside support a few points down but no descending resistance like we have with TSLA.
NVDA
I don't know why, but I find NVDA such a boring stock, so I will keep this brief.
Monday Range: 260 - 274
Bullish price: Break over 272
Bearish price: break below 261
Sentiment: Interestingly, calculations think this is bearish. It thinks that it won't be able to make a high over 273.75. Sentiment calculations for NVDA, are hit and miss. I think the accuracy is around 75 to 80% on backtesting, but I don't ever trade NVDA so I can speak to real world applications of this data. I just have it for interest sake!
Technical Standpoint
Can be summarized with one word. Messy.
We have it currently in a downtrend. There is some overhead resistance. I think it may be aiming for the rocket ship type pattern (see below).
But overall, seems like its unsure of its next big move.
Summarizing
So, out of the 4 stocks included, 3 all predict a sentiment of good movement in both directions. None of the data is overwhelmingly bearish, its all fairly mellow. To put it in perspective, when SPY did that run to 415 approx 2 Mondays ago, the data was EXTREMELY convincingly bearish over the weekend and on futures open. I am not getting any of that currently.
SO I would expect a relatively unremarkable data on Monday. Just stocks doing their thing, minding their own business, etc. etc.
I would avoid NVDA though. It just seems the least convincing of all of them. But you obviously do you!
And I know SPY is not included here. As usual, I will post after the first 1 hour of futures data for SPY, as that first 1 hour really allows me to hone in my calculations and projections!
Thanks everyone! Enjoy the rest of your weekend! Keep it restful and, as always, be safe!
Let me know your comments, questions and criticisms below.
Not financial advice!
Note
Realized I drew the NVDA channel wrong. See, I am not a TA haha. I rely 95% on mathematically calculated levels and 5% on intra-day chart patterns. But I try! See below for the amended chart. Realize it doesn't change much of the outcome as my analysis was quant based and the TA aspect was just supplementary :-).
Get:
- Live Updates,
- Discord access,
- Access to my Proprietary Merlin Software,
- Access to premium indicators,
patreon.com/steversteves
Now on X!
- Live Updates,
- Discord access,
- Access to my Proprietary Merlin Software,
- Access to premium indicators,
patreon.com/steversteves
Now on X!
Disclaimer
The information and publications are not meant to be, and do not constitute, financial, investment, trading, or other types of advice or recommendations supplied or endorsed by TradingView. Read more in the Terms of Use.