QQQ: Riding the Growth Wave – Key Demand Zones! 🌊
QQQ continues its impressive ascent, firmly entrenched within a well-defined long-term bullish channel. The daily timeframe reveals critical demand zones currently in play, shaping the index's immediate future.
Disclaimer:
The information provided in this chart is for educational and informational purposes only and should not be considered as investment advice. Trading and investing involve substantial risk and are not suitable for every investor. You should carefully consider your financial situation and consult with a financial advisor before making any investment decisions. The creator of this chart does not guarantee any specific outcome or profit and is not responsible for any losses incurred as a result of using this information. Past performance is not indicative of future results. Use this information at your own risk. This chart has been created for my own improvement in Trading and Investment Analysis. Please do your own analysis before any investments.
QQQ continues its impressive ascent, firmly entrenched within a well-defined long-term bullish channel. The daily timeframe reveals critical demand zones currently in play, shaping the index's immediate future.
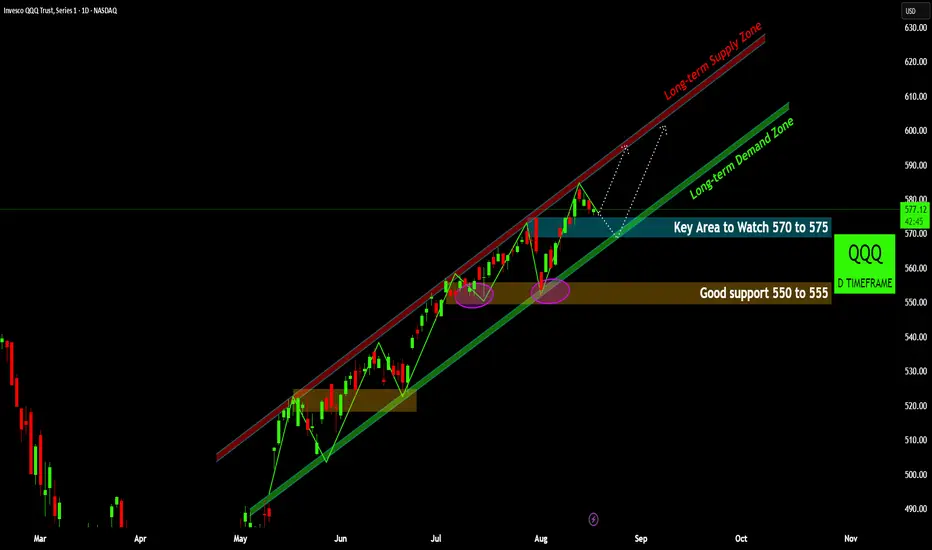
- Persistent Bullish Channel: QQQ has maintained a robust uptrend within a clear long-term demand zone (green trendline) and is approaching the long-term supply zone (red trendline) 📊. This structure signifies consistent buyer interest and upward momentum.
- Immediate Support in Focus: The 570-575 area 💙 represents a crucial immediate support zone. This level aligns directly with the lower boundary of the long-term demand channel, making it a pivotal area for buyers to defend and sustain the current uptrend.
- Stronger Foundational Support: Should the immediate support yield, a more significant "good support" lies within the 550-555 range 🟠. This zone has historically proven resilient, acting as a strong floor for previous pullbacks and providing a robust buying opportunity.
- Path to Supply Zone: A successful rebound from the current demand zone, particularly if the
570-575 level holds strong, would likely propel QQQ back towards its long-term supply zone 🔴. This upper channel boundary would represent the next major resistance target. - Outlook: The overall bullish trend remains intact as long as QQQ respects its long-term demand channel. Vigilance at the 570-575 level is key. A decisive break below this, however, could see the index testing the stronger 550-555 support ⚠️.
Disclaimer:
The information provided in this chart is for educational and informational purposes only and should not be considered as investment advice. Trading and investing involve substantial risk and are not suitable for every investor. You should carefully consider your financial situation and consult with a financial advisor before making any investment decisions. The creator of this chart does not guarantee any specific outcome or profit and is not responsible for any losses incurred as a result of using this information. Past performance is not indicative of future results. Use this information at your own risk. This chart has been created for my own improvement in Trading and Investment Analysis. Please do your own analysis before any investments.
Disclaimer
The information and publications are not meant to be, and do not constitute, financial, investment, trading, or other types of advice or recommendations supplied or endorsed by TradingView. Read more in the Terms of Use.
Disclaimer
The information and publications are not meant to be, and do not constitute, financial, investment, trading, or other types of advice or recommendations supplied or endorsed by TradingView. Read more in the Terms of Use.