Market Outlook (QQQ / NQ Analysis)
📅 Date: April 29, 2025
🕰 Timeframe: 30-minute
📈 Asset: Invesco QQQ Trust (NASDAQ: QQQ) / NQ Futures
📊 Gamma Reference: SpotGamma levels with Zero Gamma & Put/Call Walls
🧠 Key Levels & Price Map
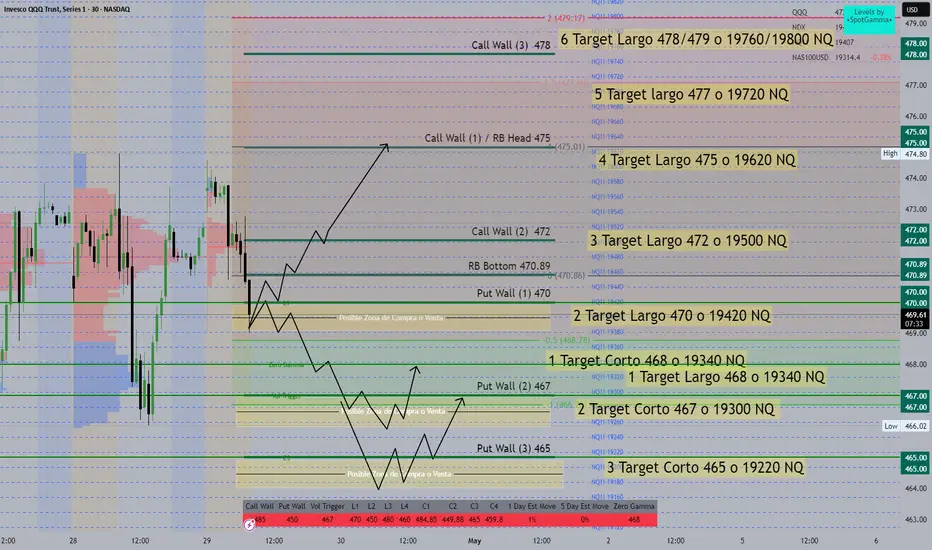
Level Type QQQ Price NQ Equivalent Comment
Call Wall (3) 478 19760 / 19800 🔼 Target 6 - Bullish Exhaustion
Target Long 477 19720 🔼 Target 5
Call Wall / RB Head 475 19620 🔼 Target 4 / High Confluence
Call Wall 472 19500 🔼 Target 3
RB Bottom 470.89 — Intermediate Resistance
Put Wall (1) 470 19420 🔼 Target 2 (bullish if broken)
Fib 0.5 468.78 — Reversal Zone
Put Wall (2) 467 19340 🔽 Target 1 - Short Bias Begins
Put Wall (3) 465 19220 🔽 Target 3 - Strong Bearish Zone
📉 Gamma & Sentiment Context
Zero Gamma: At 468 – market may be more volatile below this level.
Vol Trigger: At 467 – below this level, dealers may hedge by selling, increasing downside pressure.
Put Walls: Act as potential support or reversal zones (465, 467, 470).
Call Walls: Act as resistance or bullish break levels (472, 475, 478).
🧭 Possible Scenarios
📈 Bullish Path
If price breaks above 470, next long target is 472, then 475 (high confluence with RB Head and Call Wall).
Above 475, potential acceleration toward 478–479 (high call gamma zone).
📉 Bearish Path
Rejection at 470–472 could lead to a retest of 467, then 465.
Below 465, expect a push toward 19300–19220 NQ, aligning with the lower Put Walls.
📅 Date: April 29, 2025
🕰 Timeframe: 30-minute
📈 Asset: Invesco QQQ Trust (NASDAQ: QQQ) / NQ Futures
📊 Gamma Reference: SpotGamma levels with Zero Gamma & Put/Call Walls
🧠 Key Levels & Price Map
Level Type QQQ Price NQ Equivalent Comment
Call Wall (3) 478 19760 / 19800 🔼 Target 6 - Bullish Exhaustion
Target Long 477 19720 🔼 Target 5
Call Wall / RB Head 475 19620 🔼 Target 4 / High Confluence
Call Wall 472 19500 🔼 Target 3
RB Bottom 470.89 — Intermediate Resistance
Put Wall (1) 470 19420 🔼 Target 2 (bullish if broken)
Fib 0.5 468.78 — Reversal Zone
Put Wall (2) 467 19340 🔽 Target 1 - Short Bias Begins
Put Wall (3) 465 19220 🔽 Target 3 - Strong Bearish Zone
📉 Gamma & Sentiment Context
Zero Gamma: At 468 – market may be more volatile below this level.
Vol Trigger: At 467 – below this level, dealers may hedge by selling, increasing downside pressure.
Put Walls: Act as potential support or reversal zones (465, 467, 470).
Call Walls: Act as resistance or bullish break levels (472, 475, 478).
🧭 Possible Scenarios
📈 Bullish Path
If price breaks above 470, next long target is 472, then 475 (high confluence with RB Head and Call Wall).
Above 475, potential acceleration toward 478–479 (high call gamma zone).
📉 Bearish Path
Rejection at 470–472 could lead to a retest of 467, then 465.
Below 465, expect a push toward 19300–19220 NQ, aligning with the lower Put Walls.
Disclaimer
The information and publications are not meant to be, and do not constitute, financial, investment, trading, or other types of advice or recommendations supplied or endorsed by TradingView. Read more in the Terms of Use.
Disclaimer
The information and publications are not meant to be, and do not constitute, financial, investment, trading, or other types of advice or recommendations supplied or endorsed by TradingView. Read more in the Terms of Use.