Looking at this, looks like we could see a continuation of pullback. No huge amounts of short interest for next week after the squeeze we saw this week, so that generally is when the market decides to actually pullback.
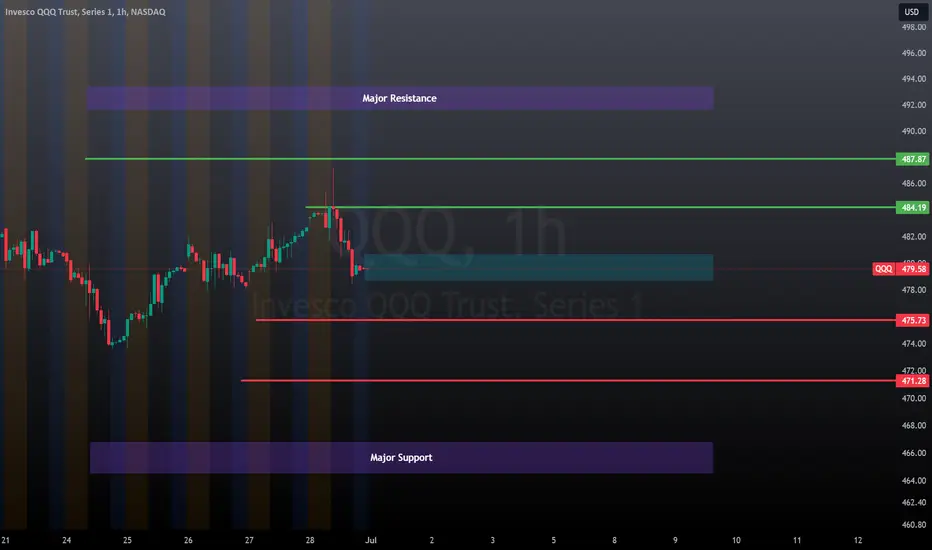
Levels to watch are in the chart.
Most likely high is 484 and most likely low is 475.
Purple boxes represent max high and low ranges.
Bias remains overall to the upside in the long term but caution is merited into next week of a continuation of pullback.
Levels to watch are in the chart.
Most likely high is 484 and most likely low is 475.
Purple boxes represent max high and low ranges.
Bias remains overall to the upside in the long term but caution is merited into next week of a continuation of pullback.
Easter sale starts April 18th for 50% off!
Get:
- Live Updates,
- Discord access,
- Access to my Proprietary Merlin Software,
- Access to premium indicators,
patreon.com/steversteves
Get:
- Live Updates,
- Discord access,
- Access to my Proprietary Merlin Software,
- Access to premium indicators,
patreon.com/steversteves
Disclaimer
The information and publications are not meant to be, and do not constitute, financial, investment, trading, or other types of advice or recommendations supplied or endorsed by TradingView. Read more in the Terms of Use.