Momentum indicators (like stoch/RSI) are mid-range, so still room either way
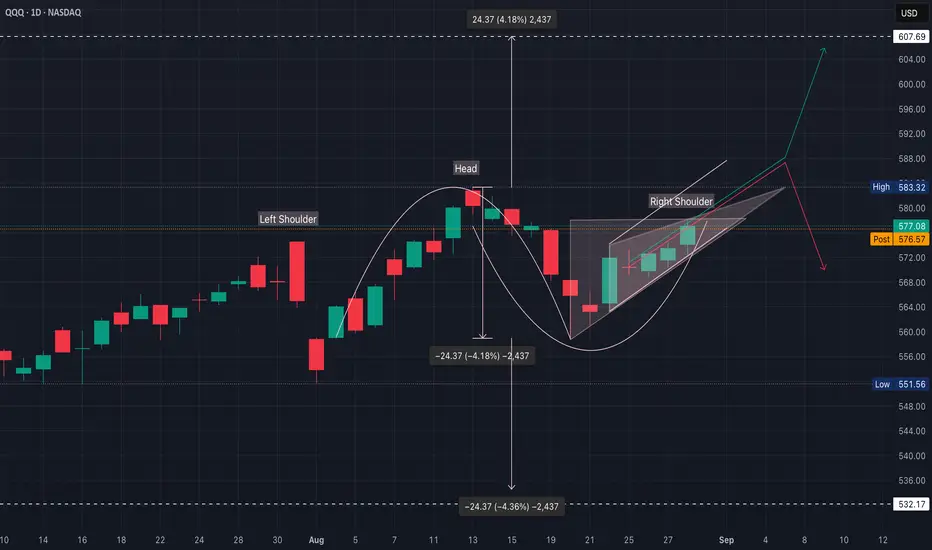
What we’ve seen since mid-August looks more like a round bottom recovery than an upside-down “U”
However, the bounce off $559 hasn’t been shallow; instead, price has climbed into a rising channel
A close above $583 on volume invalidates the bear case
A breakdown of the rising wedge (below ~$572 then $568)
Right now, a bearish wedge inside the potential inverted cup & handle
1. Bearish Case (~55% probability)
2. Bullish Case (≈40% probability)
3. Neutral/Chop (≈5% probability)
$583 is the decision point & $568 is the neckline where bears are in control
- The dominant developing pattern is an ascending triangle under $580
- That favors a bullish breakout if buyers hold $574–$575
- If ~$580 fails again, it flips into a short-term pullback
What we’ve seen since mid-August looks more like a round bottom recovery than an upside-down “U”
- The “handle-like” action under $580 is tight & flat, not sloping down
- That aligns more with an ascending triangle (bullish) than an inverted cup & handle (bearish)
- If this were a true inverted cup & handle, expect a weak “handle” bounce that fails near resistance before rolling over
However, the bounce off $559 hasn’t been shallow; instead, price has climbed into a rising channel
- That channel is more characteristic of a bearish rising wedge than a handle
- Rising wedges often resolve lower, but they do climb higher first, sometimes to retest prior resistance ($580–$583)
A close above $583 on volume invalidates the bear case
- Negates the “cup” idea & confirms a breakout
A breakdown of the rising wedge (below ~$572 then $568)
- Aligns with the inverted cup & handle thesis and target ~$559
Right now, a bearish wedge inside the potential inverted cup & handle
- If it breaks down, it validates the bearish case
- If it powers through $583, it flips back to bullish continuation
- Trading a bearish setup inside an uptrend context
- Inverted cup + wedge is bearish, but bulls still have a chance until $583 is rejected
- Think of 583 as the “line in the sand”
1. Bearish Case (~55% probability)
- Head & Shoulders + rising wedge
- Failure to break/close above $583
- Target $568 (neckline)
- If sellers press, $550–$555 with a full measured move to ~$532, but may need a macro shock to hit
2. Bullish Case (≈40% probability)
- Strong breakout & hold above $583
- Squeeze toward $590 (prior resistance)
- If momentum + AI narrative revives, $605–$607
- Would represent a sentiment shift
3. Neutral/Chop (≈5% probability)
- Sideways consolidation $570–$580
- Economic data this week comes mixed results in no conviction
$583 is the decision point & $568 is the neckline where bears are in control
- NVDA earnings reaction + economic data (jobs, inflation)
- If rally is on weak volume, likely a bull trap
- The market leans bearish unless bulls can decisively close >$583
I am not a licensed professional & these posts are for informational purposes only, not financial advice
Disclaimer
The information and publications are not meant to be, and do not constitute, financial, investment, trading, or other types of advice or recommendations supplied or endorsed by TradingView. Read more in the Terms of Use.