Key Analysis – QQQ (May 1st, 2025)
📍 Current Price Context
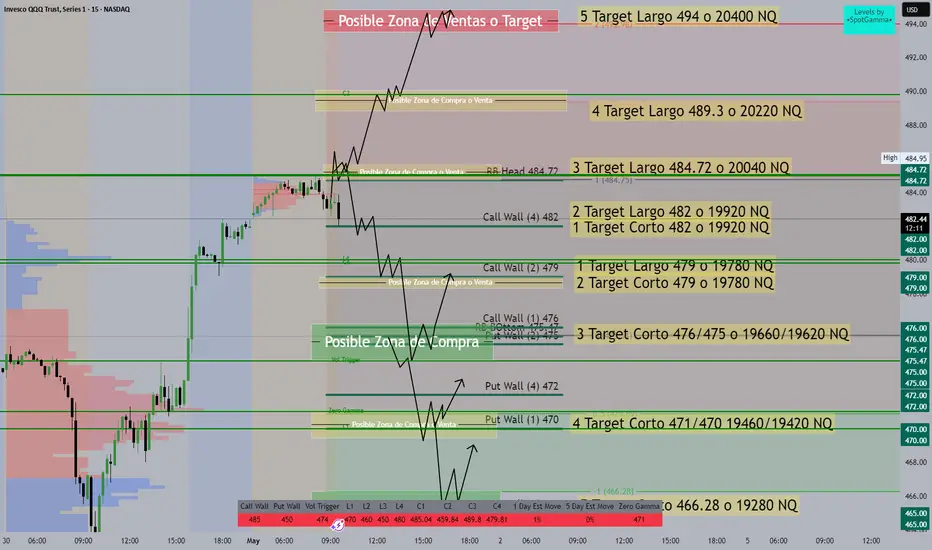
Price is currently around 484.75 after a strong upward move.
Trading near a Call Wall at 482 and a potential Rejection Block Head at 484.72.
🔼 Upside Targets (Bullish Scenario)
📈 Level 🎯 Target Description NQ Equivalent
1 482 – Call Wall 19920
2 484.72 – RB Head 20040
3 489.3 – Target Resistance 20220
4 494 – Strong Sell Zone 20400
🟩 "Possible Sell Zone" is clearly marked between 489–494, indicating potential profit-taking or reversals.
🔽 Downside Targets (Bearish Scenario)
📉 Level 🔻 Target Description NQ Equivalent
1 479 – Call Wall 19780
2 476/475 – Gamma Cluster 19660/19620
3 472 – Put Wall —
4 470/471 – Strong Gamma Line 19420/19460
5 466.28 – Extreme Bear Target 19280
🟩 "Possible Buy Zone" around 470–474, reinforced by the Zero Gamma Line at 471, is where strong bounce reactions may occur.
🔄 Strategic Zones (For Entry/Exit)
🟨 Neutral Zones (Buy/Sell Opportunity):
479 (Decision level based on flow)
484 (retest or breakout area)
🟩 Strong Demand Zone:
Between 470 and 472 – Strong gamma support + Put Walls
🟥 Strong Supply Zone:
Between 489 and 494 – High concentration of call options and projected resistance
🔀 Expected Scenarios
Bullish Breakout: If price holds above 484.72 → potential path toward 489.3 → 494.
Rejection at 484–485: Pullback to 479 → watch reaction near 476–472 for potential bounce.
Bearish Breakdown: Below 472, potential retest of 470/466 area.
📍 Current Price Context
Price is currently around 484.75 after a strong upward move.
Trading near a Call Wall at 482 and a potential Rejection Block Head at 484.72.
🔼 Upside Targets (Bullish Scenario)
📈 Level 🎯 Target Description NQ Equivalent
1 482 – Call Wall 19920
2 484.72 – RB Head 20040
3 489.3 – Target Resistance 20220
4 494 – Strong Sell Zone 20400
🟩 "Possible Sell Zone" is clearly marked between 489–494, indicating potential profit-taking or reversals.
🔽 Downside Targets (Bearish Scenario)
📉 Level 🔻 Target Description NQ Equivalent
1 479 – Call Wall 19780
2 476/475 – Gamma Cluster 19660/19620
3 472 – Put Wall —
4 470/471 – Strong Gamma Line 19420/19460
5 466.28 – Extreme Bear Target 19280
🟩 "Possible Buy Zone" around 470–474, reinforced by the Zero Gamma Line at 471, is where strong bounce reactions may occur.
🔄 Strategic Zones (For Entry/Exit)
🟨 Neutral Zones (Buy/Sell Opportunity):
479 (Decision level based on flow)
484 (retest or breakout area)
🟩 Strong Demand Zone:
Between 470 and 472 – Strong gamma support + Put Walls
🟥 Strong Supply Zone:
Between 489 and 494 – High concentration of call options and projected resistance
🔀 Expected Scenarios
Bullish Breakout: If price holds above 484.72 → potential path toward 489.3 → 494.
Rejection at 484–485: Pullback to 479 → watch reaction near 476–472 for potential bounce.
Bearish Breakdown: Below 472, potential retest of 470/466 area.
Disclaimer
The information and publications are not meant to be, and do not constitute, financial, investment, trading, or other types of advice or recommendations supplied or endorsed by TradingView. Read more in the Terms of Use.
Disclaimer
The information and publications are not meant to be, and do not constitute, financial, investment, trading, or other types of advice or recommendations supplied or endorsed by TradingView. Read more in the Terms of Use.