QQQ Liquidity Map Analysis – May 5, 2025
Data Source: SpotGamma + Price Action + Option Walls
🔍 Key Levels and Zones:
Zone Type Price Level NQ Equivalent Commentary
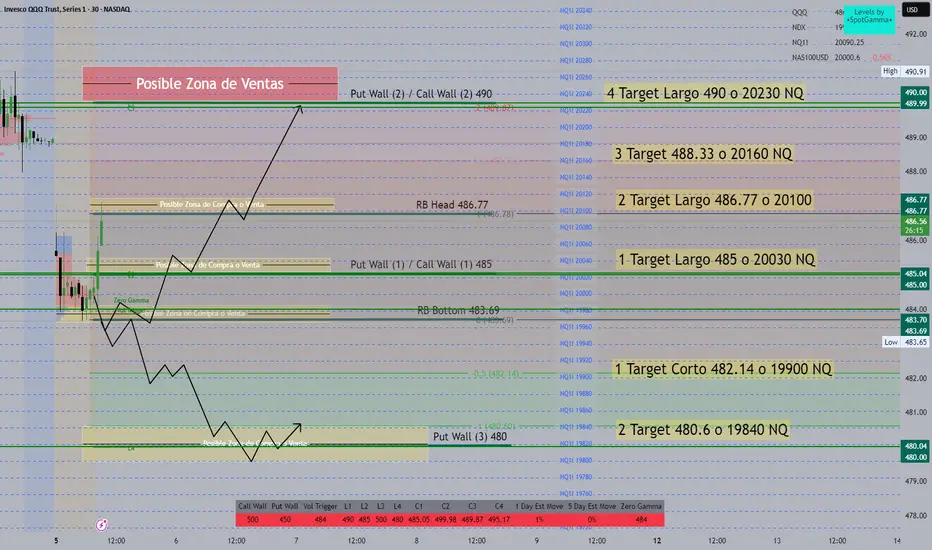
Call/Put Wall (Major) 490 20230 NQ 🔴 Strong Sell Zone. High probability of reversal.
Target Area 3 488.33 20160 NQ 🎯 Possible intermediate resistance level.
Target Area 2 486.77 20100 NQ 🎯 Watch for reactions; aligns with “RB Head.”
Target Area 1 485.00 20030 NQ 📌 First bullish target; aligns with strong option wall.
Zero Gamma 484.00 — ⚠️ Equilibrium level — market may flip bias around here.
RB Bottom 483.69 19980 NQ ✅ Key reaction zone. Below here, bias turns bearish.
Put Wall (3) 480.00 19840 NQ 🟡 Strong support — possible bounce zone.
📈 Scenario 1: Bullish Case
If price holds above RB Bottom 483.69, we could see:
485 → First long target.
486.77 → Second long target.
488.33 → Momentum continuation.
490 → Final target & major sell zone.
🔼 Bias: Long above 484 / Confirm above 485
📉 Scenario 2: Bearish Case
If price fails to hold Zero Gamma (484) and breaks below:
482.14 → Short-term bearish target (19900 NQ).
480.6 → Extended target (Put Wall 3, 19840 NQ).
🔽 Bias: Short below 484 / Confirm below 483.7
🧠 Psychological Zones:
490: "Sell the rip" level — high call wall pressure.
484-485: Market equilibrium zone, pivot level.
480: Last stand for bulls. Below this, bears gain control.
🚨 Strategy Tips:
Use confirmation candles on the 15–30min for entries.
Combine with volume spikes or order flow data (Bookmap/Footprint).
Watch for reactions near RB Zones and Walls for intraday scalps.
💬 Summary Quote:
“The market moves where options dealers are forced to hedge. Identify their pain points, and you'll find your edge.” — JP Investment
Data Source: SpotGamma + Price Action + Option Walls
🔍 Key Levels and Zones:
Zone Type Price Level NQ Equivalent Commentary
Call/Put Wall (Major) 490 20230 NQ 🔴 Strong Sell Zone. High probability of reversal.
Target Area 3 488.33 20160 NQ 🎯 Possible intermediate resistance level.
Target Area 2 486.77 20100 NQ 🎯 Watch for reactions; aligns with “RB Head.”
Target Area 1 485.00 20030 NQ 📌 First bullish target; aligns with strong option wall.
Zero Gamma 484.00 — ⚠️ Equilibrium level — market may flip bias around here.
RB Bottom 483.69 19980 NQ ✅ Key reaction zone. Below here, bias turns bearish.
Put Wall (3) 480.00 19840 NQ 🟡 Strong support — possible bounce zone.
📈 Scenario 1: Bullish Case
If price holds above RB Bottom 483.69, we could see:
485 → First long target.
486.77 → Second long target.
488.33 → Momentum continuation.
490 → Final target & major sell zone.
🔼 Bias: Long above 484 / Confirm above 485
📉 Scenario 2: Bearish Case
If price fails to hold Zero Gamma (484) and breaks below:
482.14 → Short-term bearish target (19900 NQ).
480.6 → Extended target (Put Wall 3, 19840 NQ).
🔽 Bias: Short below 484 / Confirm below 483.7
🧠 Psychological Zones:
490: "Sell the rip" level — high call wall pressure.
484-485: Market equilibrium zone, pivot level.
480: Last stand for bulls. Below this, bears gain control.
🚨 Strategy Tips:
Use confirmation candles on the 15–30min for entries.
Combine with volume spikes or order flow data (Bookmap/Footprint).
Watch for reactions near RB Zones and Walls for intraday scalps.
💬 Summary Quote:
“The market moves where options dealers are forced to hedge. Identify their pain points, and you'll find your edge.” — JP Investment
Disclaimer
The information and publications are not meant to be, and do not constitute, financial, investment, trading, or other types of advice or recommendations supplied or endorsed by TradingView. Read more in the Terms of Use.
Disclaimer
The information and publications are not meant to be, and do not constitute, financial, investment, trading, or other types of advice or recommendations supplied or endorsed by TradingView. Read more in the Terms of Use.