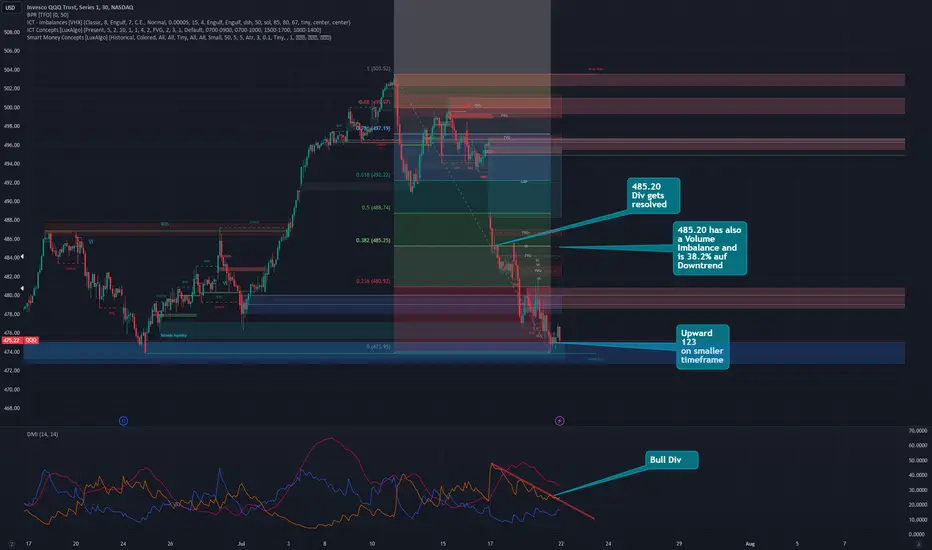
I have plotted all relevant marks and technical developments directly on the chart.
To explain briefly: we see a pronounced bullish divergence in the DMI. This divergence should resolve itself in the upcoming week.
The divergence would be resolved if the price were to close at 485.20 or higher on an M30 basis.
The 38.2% retracement of the downward movement since July 10, 2024 and a volume imbalance are located at exactly this level.
In the small time frames, a tentative upward movement in the form of an upward 123 pattern was seen at the close of trading on Friday.
This recovery is very fragile. Nevertheless, it can be assumed that the price will soon resolve the bullish divergence, especially as the corresponding mark is of great technical relevance.
Disclaimer
The information and publications are not meant to be, and do not constitute, financial, investment, trading, or other types of advice or recommendations supplied or endorsed by TradingView. Read more in the Terms of Use.
Disclaimer
The information and publications are not meant to be, and do not constitute, financial, investment, trading, or other types of advice or recommendations supplied or endorsed by TradingView. Read more in the Terms of Use.