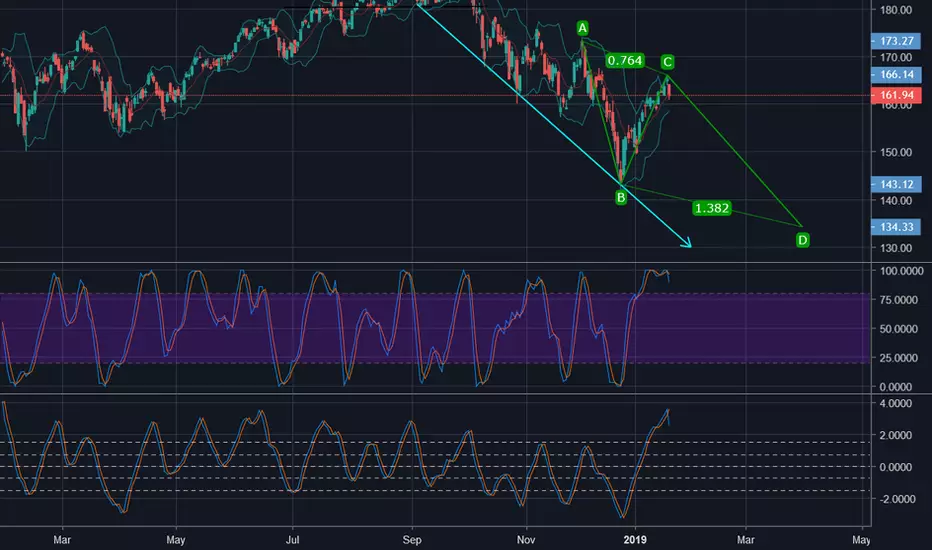
Today's selloff marks a 0.764 fib retracement level (1 - 0.236) on the daily chart. Potential beginning a phase C of an ABCD pattern, indicated by stochastic RSI and fisher transform. Watch the next few days for trend confirmation/rejection. Central banks are running the show, don't get greedy.
SL @166.0
TP @134.33 or above
SL @166.0
TP @134.33 or above
Disclaimer
The information and publications are not meant to be, and do not constitute, financial, investment, trading, or other types of advice or recommendations supplied or endorsed by TradingView. Read more in the Terms of Use.
Disclaimer
The information and publications are not meant to be, and do not constitute, financial, investment, trading, or other types of advice or recommendations supplied or endorsed by TradingView. Read more in the Terms of Use.