QS in a Potential and Complex Pattern
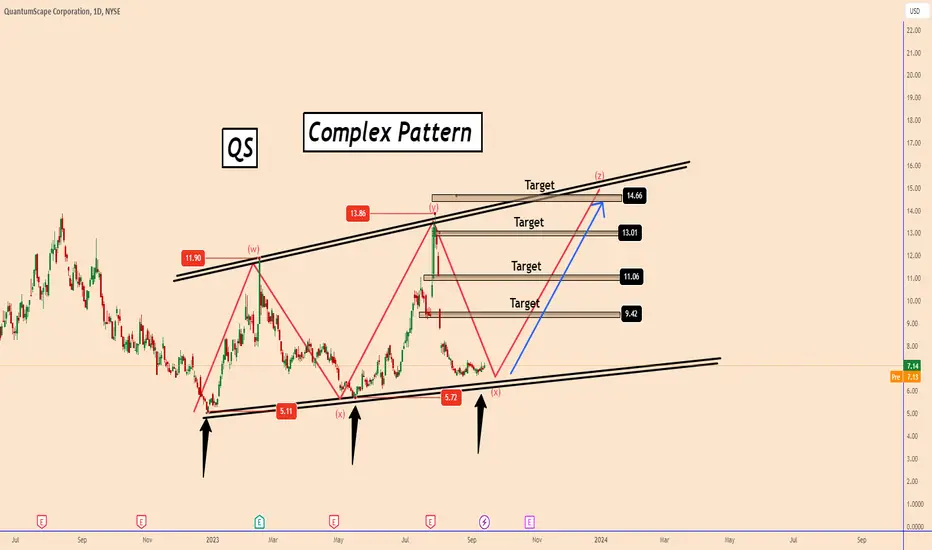
The price looks like it is creating a complex pattern for Quantum Scape Corporation.
The interesting fact on this chart is that the lowest low was created at 5.11 and later the price
created a top at 11.90. Later moved down again but it didn't create a new low as it was 5.72 and the new price high was 13.86
SO overall the price is expanding on the upper part of the pattern and this is increasing the
chances for the Z wave or WXWXZ pattern. A double zigzag complex pattern.
You may find more details on the chart.
Thank you and Good Luck!
✅MY Free Signals
t.me/TradingPuzzles
✅Personal Telegram
t.me/KlejdiCuni
✅YouTube
youtube.com/@TradingPuzzles
✅MY Recommended Broker is TRADE NATION
🔸bit.ly/49VySJF
t.me/TradingPuzzles
✅Personal Telegram
t.me/KlejdiCuni
✅YouTube
youtube.com/@TradingPuzzles
✅MY Recommended Broker is TRADE NATION
🔸bit.ly/49VySJF
Disclaimer
The information and publications are not meant to be, and do not constitute, financial, investment, trading, or other types of advice or recommendations supplied or endorsed by TradingView. Read more in the Terms of Use.