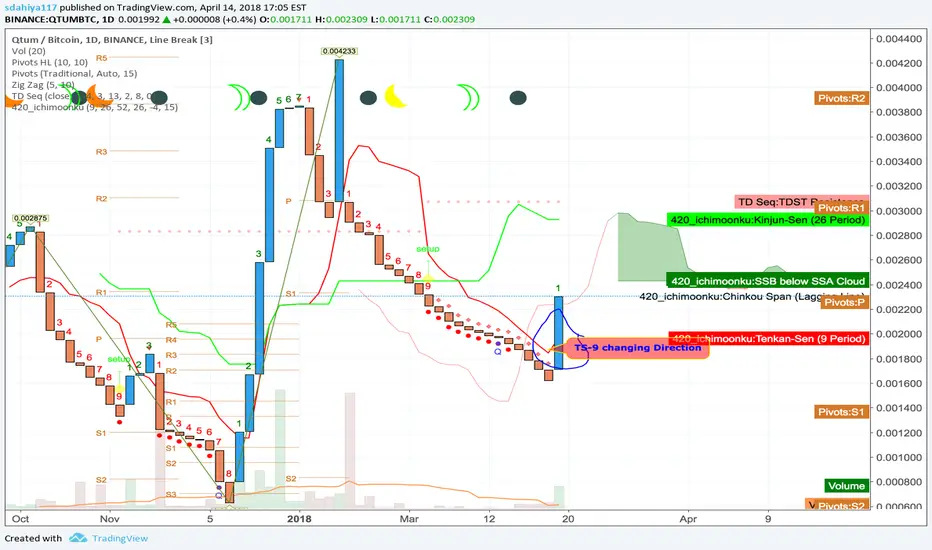
Hi Friends, here is another TA for QTUM. I have used Three line brake chart.
Three Line Break charts show a series of vertical red and blue lines. Blue lines represent rising prices, Red lines portray falling prices. Prices continue in the same direction until a reversal is warranted. A reversal occurs when the closing price exceeds the high or low of the prior two lines.
TS-9 is changing its direction
Good luck
Thank you
Disclaimer
The information and publications are not meant to be, and do not constitute, financial, investment, trading, or other types of advice or recommendations supplied or endorsed by TradingView. Read more in the Terms of Use.
Disclaimer
The information and publications are not meant to be, and do not constitute, financial, investment, trading, or other types of advice or recommendations supplied or endorsed by TradingView. Read more in the Terms of Use.