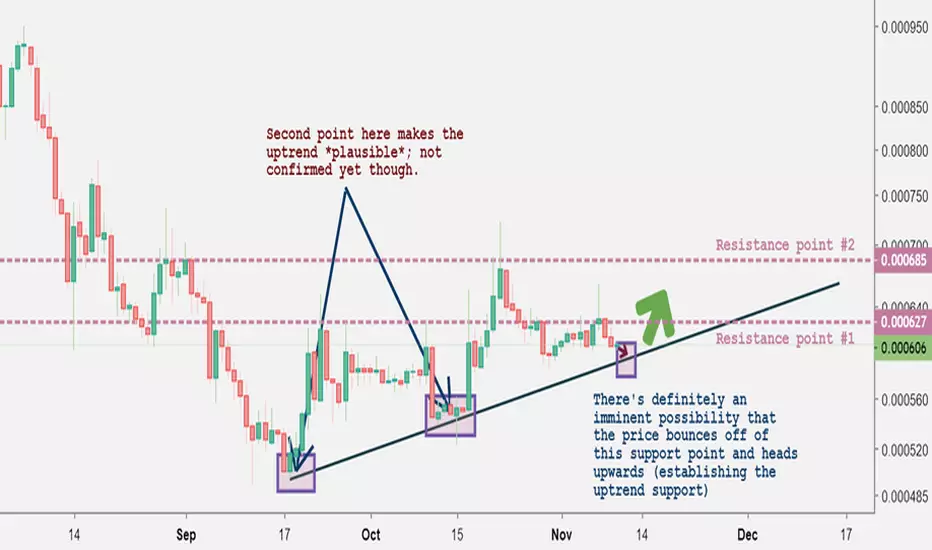
We haven't covered  QTUM in a while, so let's get to it.

So, from first glance, QTUM/BTC actually looks promising. Why not?
Let’s take another scrolled out look at the price action now:

Relative Strength Index (14)

Zerononcense Balance of Power RSI (Custom)

As we can see here, the indicator is trending heavily downwards, which indicates distribution (selling). Whenever the line turns red below the purple overlay (“oversold”), then we can begin looking at whether there is some accumulation on the chain.
Until that point, it appears that this is yet again a ‘wait and see’.
Conclusion
The positive thing here is that the downtrend has definitively been broken on the daily chart for $QTUM.
However, there is still some price action that we need to wait for before we can publish an idea in which we definitively enter into the trade.
Until that point, this is worth setting a couple of well-placed alarms on and waiting.
So, from first glance, QTUM/BTC actually looks promising. Why not?
Let’s take another scrolled out look at the price action now:
Relative Strength Index (14)
Zerononcense Balance of Power RSI (Custom)
As we can see here, the indicator is trending heavily downwards, which indicates distribution (selling). Whenever the line turns red below the purple overlay (“oversold”), then we can begin looking at whether there is some accumulation on the chain.
Until that point, it appears that this is yet again a ‘wait and see’.
Conclusion
The positive thing here is that the downtrend has definitively been broken on the daily chart for $QTUM.
However, there is still some price action that we need to wait for before we can publish an idea in which we definitively enter into the trade.
Until that point, this is worth setting a couple of well-placed alarms on and waiting.
Disclaimer
The information and publications are not meant to be, and do not constitute, financial, investment, trading, or other types of advice or recommendations supplied or endorsed by TradingView. Read more in the Terms of Use.
Disclaimer
The information and publications are not meant to be, and do not constitute, financial, investment, trading, or other types of advice or recommendations supplied or endorsed by TradingView. Read more in the Terms of Use.
