Hi Seildev here,
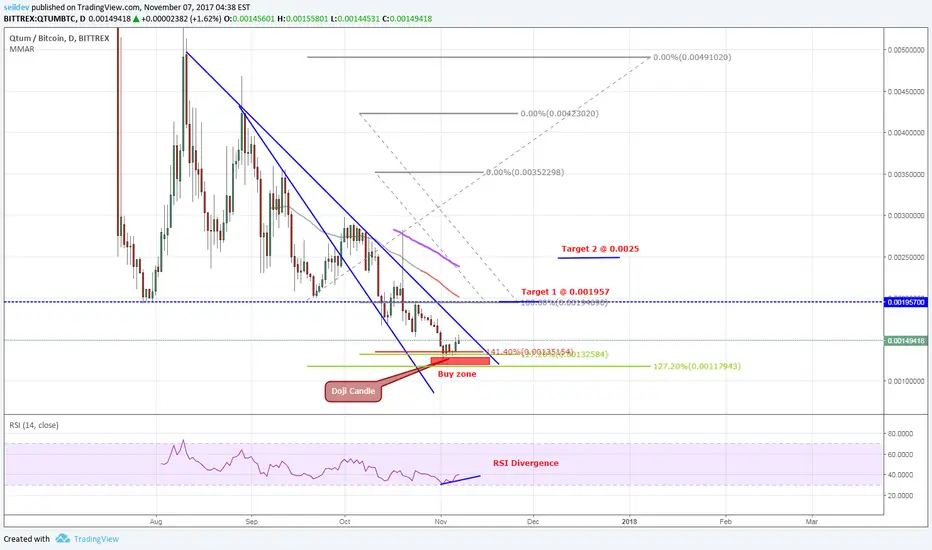
Today we're looking at Qtum/btc at a high activity zone around 0.0012 ~ 0.00128.
- Key horizontal area of interest @ 0.001957
- High of 0.0049 to 0.001957 shows Fib 127.2% at 0.001179 (Support 3)
- High of 0.00423 to 0.001957 shows Fib 127.2% at 0.00132584 (Support 2)
- High of 0.00352298 to 0.001957 shows Fib 141.4% at 0.0013515 (Support 1)
If we are to surpass key level at 0.001957 we can set our target at:
- Target 1 @ 0.001957
- Target 2 @ 0.0025
Side note:
- A nice doji candle has also formed Nov 5th
- RSI Divergence
As always trade with a plan and safe trading.
Seildev
Note
We now have seen a break out above the resistance trend line, a confirmation of bullish trendDisclaimer
The information and publications are not meant to be, and do not constitute, financial, investment, trading, or other types of advice or recommendations supplied or endorsed by TradingView. Read more in the Terms of Use.
Disclaimer
The information and publications are not meant to be, and do not constitute, financial, investment, trading, or other types of advice or recommendations supplied or endorsed by TradingView. Read more in the Terms of Use.