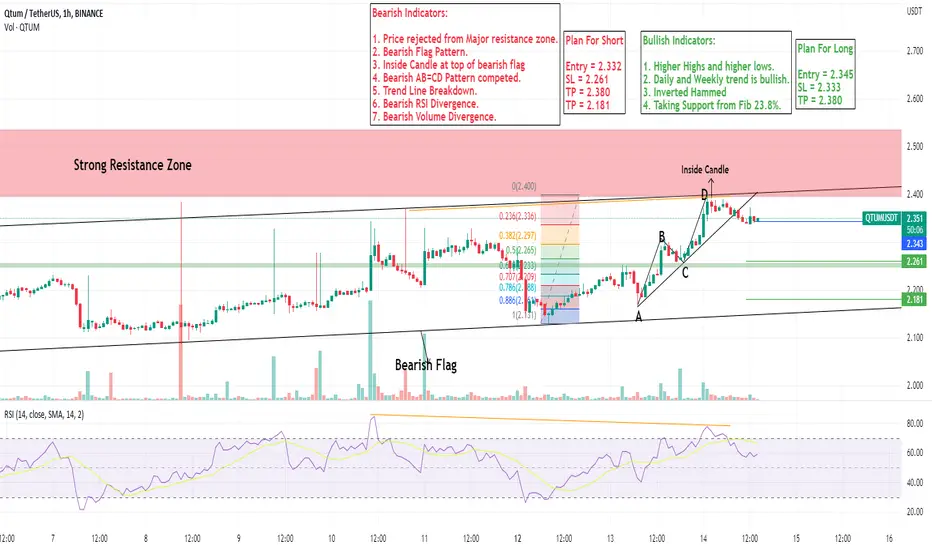
Plan For Short:
Entry = 2.332
SL = 2.261
TP = 2.380
TP = 2.181
Bearish Indicators:
1. Price rejected from Major resistance zone.
2. Bearish Flag Pattern.
3. Inside Candle at top of bearish flag
4. Bearish AB=CD Pattern competed.
5. Trend Line Breakdown.
6. Bearish RSI Divergence.
7. Bearish Volume Divergence.
Plan For Long:
Entry = 2.345
SL = 2.333
TP = 2.380
Bullish Indicators:
1. Higher Highs and higher lows.
2. Daily and Weekly trend is bullish.
3. Inverted Hammed
4. Taking Support from Fib 23.8%.
Disclaimer
The information and publications are not meant to be, and do not constitute, financial, investment, trading, or other types of advice or recommendations supplied or endorsed by TradingView. Read more in the Terms of Use.
Disclaimer
The information and publications are not meant to be, and do not constitute, financial, investment, trading, or other types of advice or recommendations supplied or endorsed by TradingView. Read more in the Terms of Use.