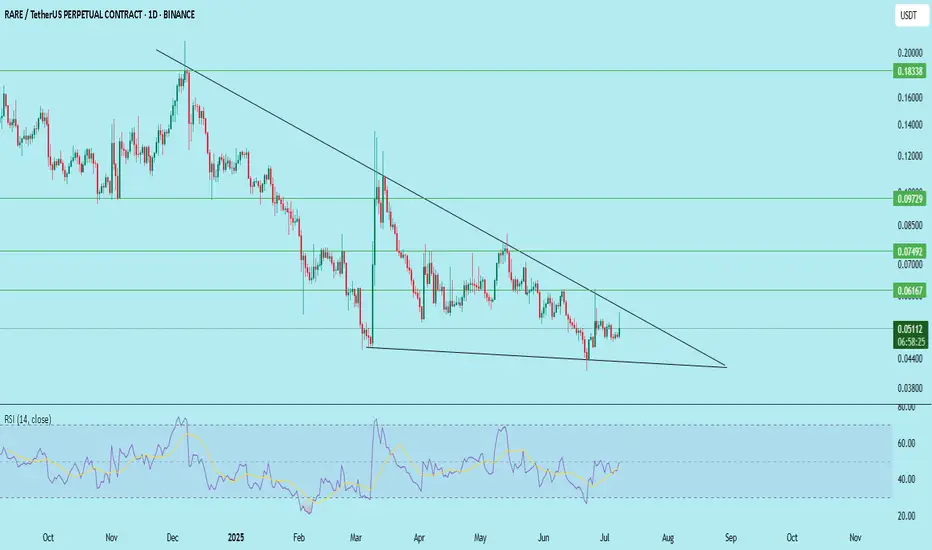
RARE is forming a long-term descending triangle and showing signs of accumulation near the bottom range. A breakout from this structure can initiate a trend reversal.
Chart Analysis:
Downtrend line tightening with horizontal support
Current price testing triangle resistance
RSI trending upward (50), early bullish signal
Key Levels:
Entry: $0.051–$0.053
Stop Loss: $0.042 (below long-term support)
Targets:
Target 1: $0.061
Target 2: $0.074
Target 3: $0.097
Target 4: $0.183 (macro target)
Support Zones: $0.042, $0.035
Breakout Confirmation: Daily close above $0.061 with volume
This is a high-risk, high-reward accumulation play for long-term investors. Wait for breakout and volume confirmation.
DYOR. Not financial advice.
Disclaimer
The information and publications are not meant to be, and do not constitute, financial, investment, trading, or other types of advice or recommendations supplied or endorsed by TradingView. Read more in the Terms of Use.
Disclaimer
The information and publications are not meant to be, and do not constitute, financial, investment, trading, or other types of advice or recommendations supplied or endorsed by TradingView. Read more in the Terms of Use.