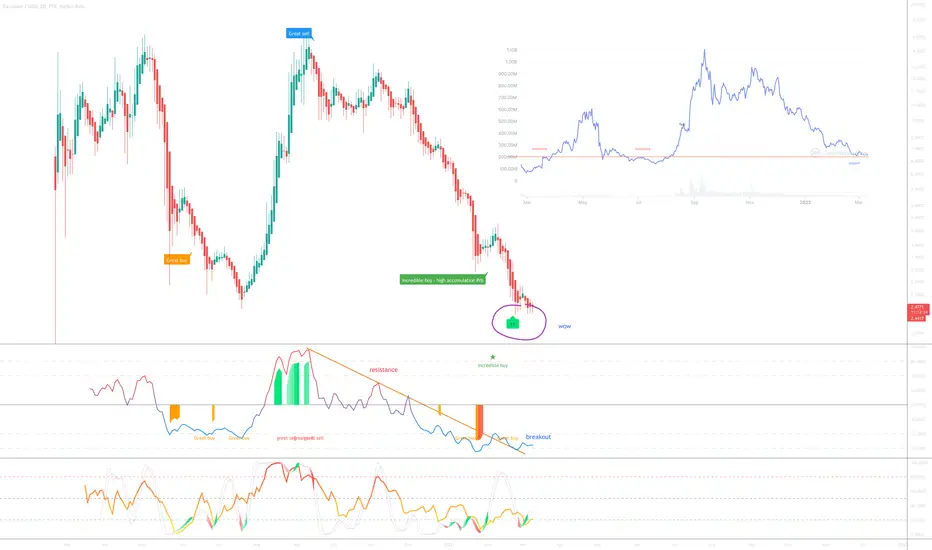
On the above 2-day chart price action has collapsed over 85% since September. Now is an excellent time to be long. Why?
1) The ‘incredible buy’ signal prints.
2) RSI resistance breakout.
3) Price action tests past resistance as support. The support is best seen on the coinmarketcap graph to the right of price action.
4) Points 1 and 2 are also true for the BTC pair. (see 2-day chart below).
5) Regular bullish divergence . Currently 11 oscillators are printing bullish divergence with price action. Fantastic.
Is it possible price action falls further? Sure.
Is it probable? No.
1st target: $15
Good luck!
2-day RAY / BTC pair
Trade active
BTC
bc1q2eckdzh0q8vsd7swcc8et6ze7s99khhxyl7zwy
Weblink: patreon.com/withoutworries
Allow 3-6 months on ideas. Not investment advice. DYOR
bc1q2eckdzh0q8vsd7swcc8et6ze7s99khhxyl7zwy
Weblink: patreon.com/withoutworries
Allow 3-6 months on ideas. Not investment advice. DYOR
Disclaimer
The information and publications are not meant to be, and do not constitute, financial, investment, trading, or other types of advice or recommendations supplied or endorsed by TradingView. Read more in the Terms of Use.