Raydium (RAY) Analysis – November 2024
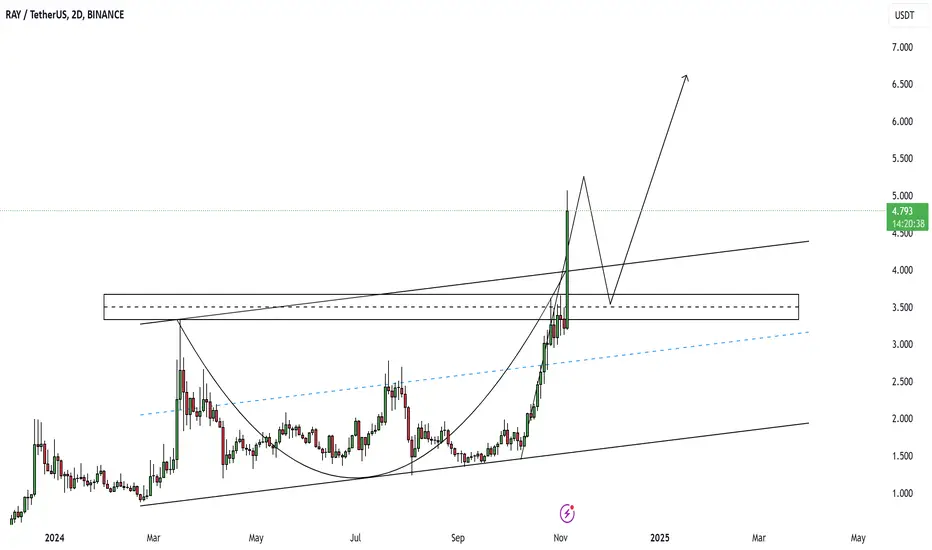
The chart highlights that RAY has experienced a significant upward movement, currently trading at $4.801 after a notable surge of +49.28%. This rise has propelled it above a key resistance zone near $3.5, which now acts as a support.
Key Observations:
Resistance and Potential Targets: The breakout above $3.5 suggests a bullish momentum. If this trend continues, RAY could reach higher targets around $6.5.
Pattern Formation: The current trajectory appears to align with a "cup and handle" pattern, typically indicative of further bullish continuation.
Next Moves: A successful consolidation above the current breakout level could pave the way for another leg up, while a fallback below $3.5 might signal the need for caution.
Conclusion:
RAY's recent momentum positions it for potential further gains, contingent on its ability to maintain above the breakout level and continue capitalizing on bullish market conditions.
#Raydium #RAY #Crypto #TechnicalAnalysis #PriceTargets
Subscribe to my Telegram Channel 👉 :
t.me/addlist/y5mi70s3c0Y3MDQ0
Subscribe to my X 👉 : x.com/VIPROSETR
t.me/addlist/y5mi70s3c0Y3MDQ0
Subscribe to my X 👉 : x.com/VIPROSETR
Disclaimer
The information and publications are not meant to be, and do not constitute, financial, investment, trading, or other types of advice or recommendations supplied or endorsed by TradingView. Read more in the Terms of Use.