Long
RCN Daily chart analysis
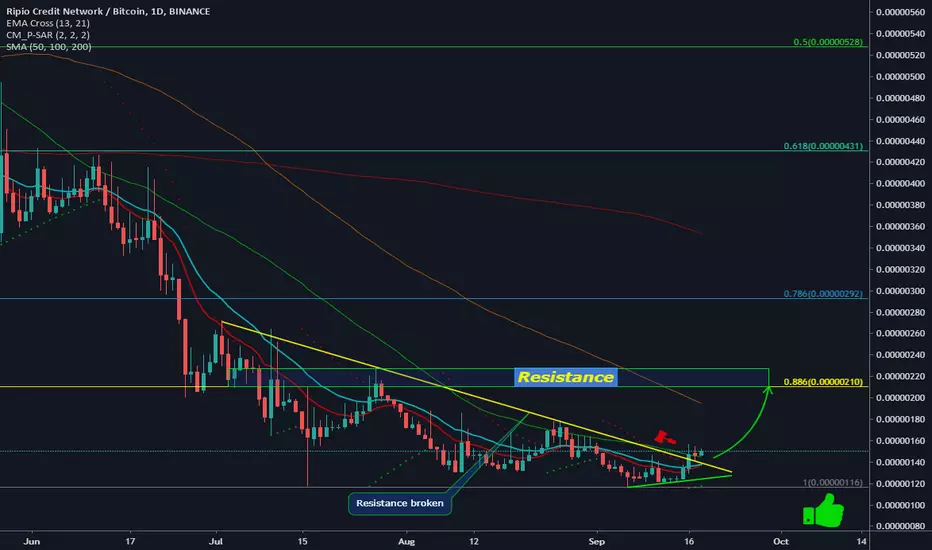
After a long decline, finally broke the resistance. Ahead of us is the first serious resistance, the level of 0.886 fib 210-228 sats. Which is a horizontal stop for buyers, and when approaching it, you should partially fix your positions.
Trade closed: target reached
Trade active
Next potential target 280-292 satTrade closed: target reached
Trade active
Next potential target is on our favorite number 0.618 430 satTrade closed: target reached
Already generated 210%+ Disclaimer
The information and publications are not meant to be, and do not constitute, financial, investment, trading, or other types of advice or recommendations supplied or endorsed by TradingView. Read more in the Terms of Use.
Disclaimer
The information and publications are not meant to be, and do not constitute, financial, investment, trading, or other types of advice or recommendations supplied or endorsed by TradingView. Read more in the Terms of Use.