Hey traders! Let’s dive into this 4-hour RDNTUSDT chart.
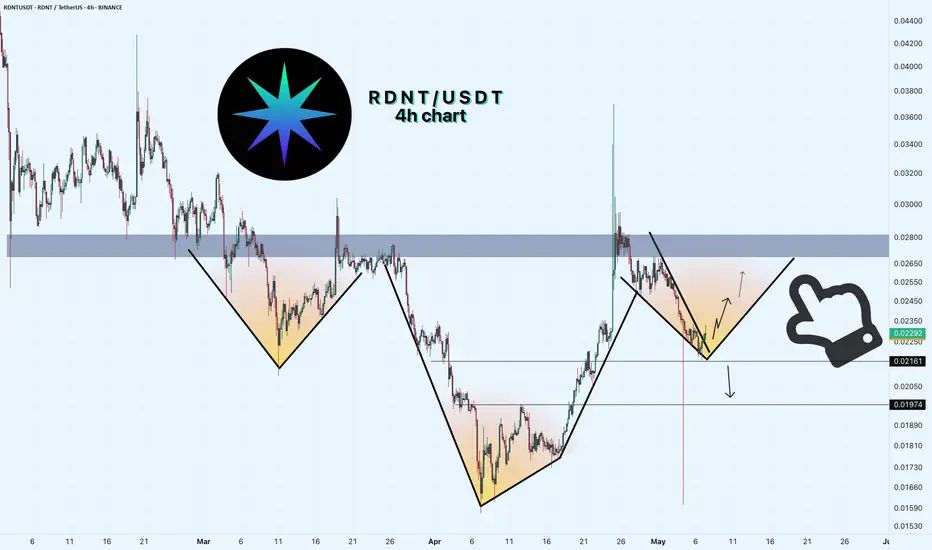
Radient Capital is setting up a classic pattern that could signal a big move!
We’re seeing an inverted head and shoulders forming, with the price breaking above the resistance of Wedge around $0.2290. The "head" bottomed out near $0.1590, with the shoulders forming at higher lows.
If this pattern plays out, we could see a bullish surge targeting $0.2650 and higher!
However, if the breakout fails, we might see a pullback to the shoulder low at $0.2160 or even the support at $0.1974.

Key Levels to Watch:
Is RDNT ready to soar, or will this breakout fail? Drop your thoughts below!
Radient Capital is setting up a classic pattern that could signal a big move!
We’re seeing an inverted head and shoulders forming, with the price breaking above the resistance of Wedge around $0.2290. The "head" bottomed out near $0.1590, with the shoulders forming at higher lows.
If this pattern plays out, we could see a bullish surge targeting $0.2650 and higher!
However, if the breakout fails, we might see a pullback to the shoulder low at $0.2160 or even the support at $0.1974.
Key Levels to Watch:
Resistance: $0.2650
Support: $0.2160 (shoulder)
Breakout Target: $0.2650+
Breakdown Risk: $0.1974
Is RDNT ready to soar, or will this breakout fail? Drop your thoughts below!
𝗔𝗥𝗧𝗘𝗠 𝗖𝗥𝗬𝗣𝗧𝗢 | 𝗦𝗶𝗻𝗰𝗲 𝟮𝟬𝟭𝟴
📲 Join Our Telegram Trading Community: t.me/+5hlxWmhHaKplN2Rk
🎙️ Daily Live Streams on 🔴 𝗬𝗼𝘂𝗧𝘂𝗯𝗲
🔍 Explore More Resources: linktr.ee/artemcrypto ✅
📲 Join Our Telegram Trading Community: t.me/+5hlxWmhHaKplN2Rk
🎙️ Daily Live Streams on 🔴 𝗬𝗼𝘂𝗧𝘂𝗯𝗲
🔍 Explore More Resources: linktr.ee/artemcrypto ✅
Disclaimer
The information and publications are not meant to be, and do not constitute, financial, investment, trading, or other types of advice or recommendations supplied or endorsed by TradingView. Read more in the Terms of Use.