Daily chart,
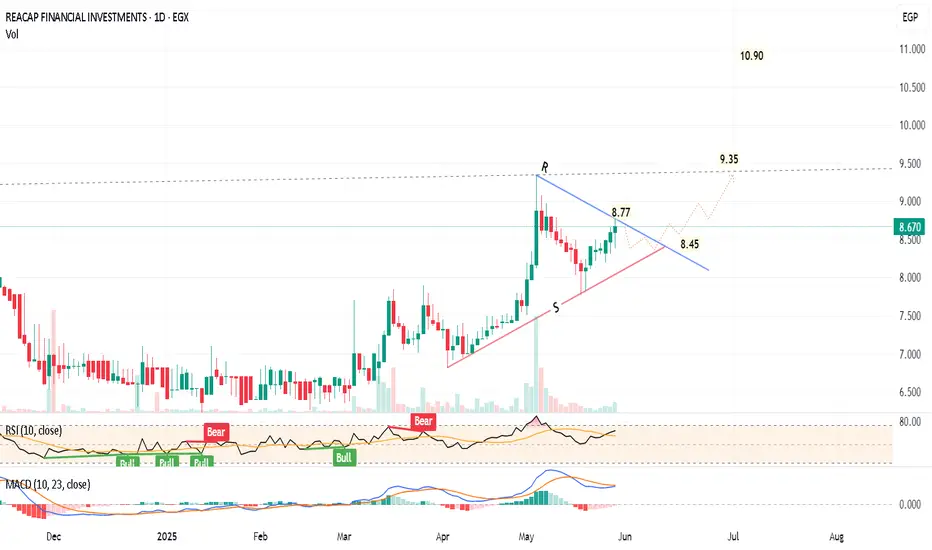
I expect the price REAC will continue to form a triangle chart pattern.
Technical indicators RSI and MACD are positive, and showing a bullish movement - i.e. A soon breakout
However, I think after a rally of 7 consecutive green candlesticks, a minor correction should happen to test the support line S.
Then, a rebound to test the upper resistance line R. The breakout can be around 8.50 - 5.45
After crossing R (and stabilizing for 2 days with high volume), the target will be 10.90 passing through a resistance level at 9.35
Stop loss below 8.40 should be considered.
2nd Scenario: Direct crossing up, no correction, and the target will be 11.25
Raise the stop loss / profit protection level as the price goes up.
I expect the price
Technical indicators RSI and MACD are positive, and showing a bullish movement - i.e. A soon breakout
However, I think after a rally of 7 consecutive green candlesticks, a minor correction should happen to test the support line S.
Then, a rebound to test the upper resistance line R. The breakout can be around 8.50 - 5.45
After crossing R (and stabilizing for 2 days with high volume), the target will be 10.90 passing through a resistance level at 9.35
Stop loss below 8.40 should be considered.
2nd Scenario: Direct crossing up, no correction, and the target will be 11.25
Raise the stop loss / profit protection level as the price goes up.
Disclaimer
The information and publications are not meant to be, and do not constitute, financial, investment, trading, or other types of advice or recommendations supplied or endorsed by TradingView. Read more in the Terms of Use.
Disclaimer
The information and publications are not meant to be, and do not constitute, financial, investment, trading, or other types of advice or recommendations supplied or endorsed by TradingView. Read more in the Terms of Use.