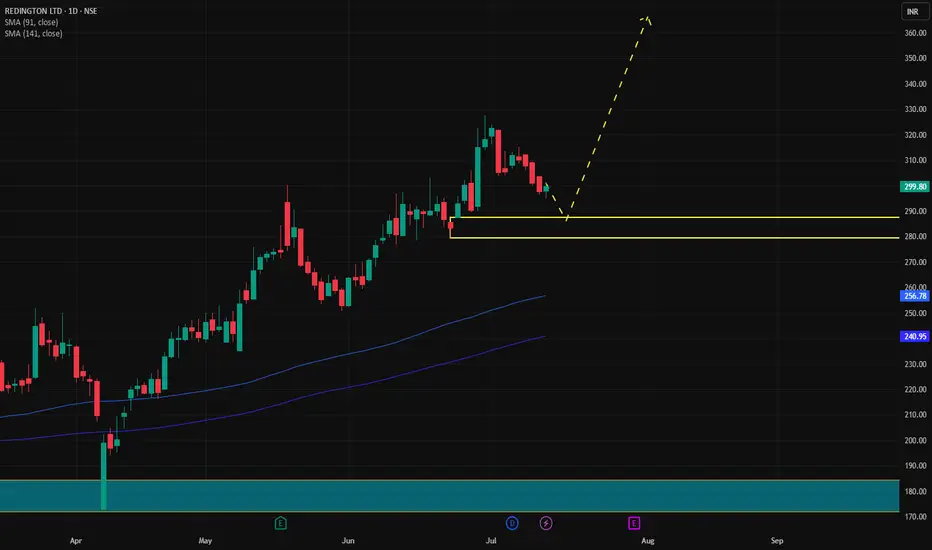
✅ Redington Buy Trade Setup
Parameter Value
Entry 287
Stop Loss (SL) 278
Risk 9 pts
Reward 88 pts
Target Price 375
Risk:Reward (RR) 9.8
📍 Other Key Levels
Metric Value
Last High 327
Last Low 279
Point Variance 48
🔎 Interpretation & Trade Insights
🔼 Trend Confirmation: Every timeframe shows an uptrend, which confirms directional conviction.
🎯 Entry Zone Strength: Your entry at 287 sits well within the Daily & Intraday demand zones (278–297), suggesting strong support below.
🛡️ Tight SL: A very tight SL of 278, right at the confluence of multiple zones. This minimizes risk.
📈 High R:R Ratio: With a Risk:Reward of 9.8, this is an excellent asymmetric setup—ideal for swing or positional trading.
💡 Target of 375 is significantly above the last high (327), which means price will need to break out to fresh highs for full realization. Keep an eye on price action near 325–330 zone for profit booking or SL trailing.
⚙️ Suggestions for Execution
🔁 Trail SL: Once price hits above 310, consider adjusting SL to entry (287) or slightly above to lock in gains.
🧱 Watch Resistance: 327 (previous high) could act as short-term resistance.
📊 Volume Confirmation: If volume expands above 300, it would strengthen breakout potential toward 350+.
📊 Demand Zone Summary
🕰️ High Time Frame (HTF)
Timeframe Logic Proximal Distal Avg
Yearly Support 225 173 199
Half-Yearly RBR Pattern 215 173 194
Quarterly BUFL + Breakout 211 173 192
HTF Avg 217 173 195
📆 Medium Time Frame (MTF)
Timeframe Logic Proximal Distal Avg
Monthly Support 300 175 238
Weekly Support 300 278 289
Daily BUFL/DMIP 287 278 283
MTF Avg 296 244 270
⏱️ Intraday Time Frame (ITF)
Timeframe Logic Proximal Distal Avg
240 Min DMIP 293 278 286
180 Min DMIP 297 278 288
60 Min DMIP 294 278 286
ITF Avg 295 278 286
Disclaimer
The information and publications are not meant to be, and do not constitute, financial, investment, trading, or other types of advice or recommendations supplied or endorsed by TradingView. Read more in the Terms of Use.
Disclaimer
The information and publications are not meant to be, and do not constitute, financial, investment, trading, or other types of advice or recommendations supplied or endorsed by TradingView. Read more in the Terms of Use.