Updated
Just a CHART
At 21:30 hours on 19th February 2021
Each candle/bar is 30 min.
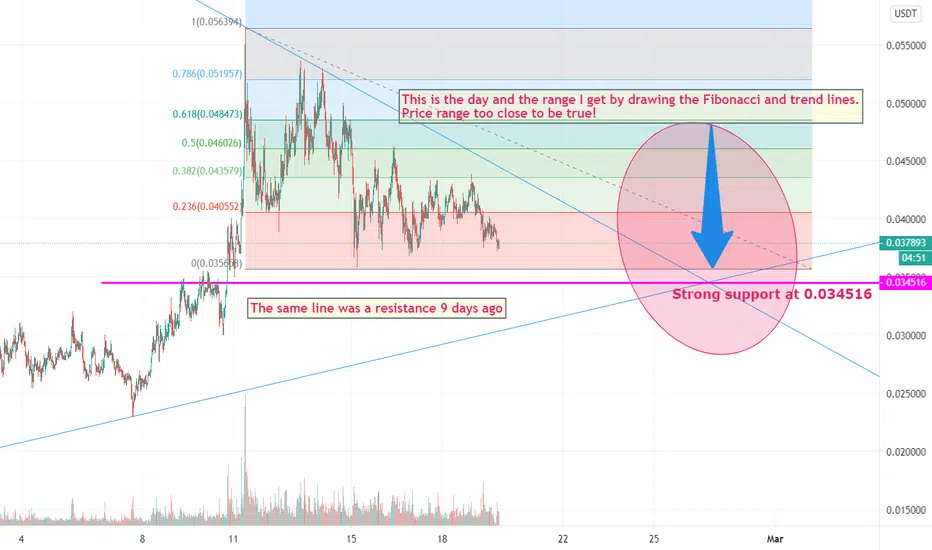
This is the day and the range I get by drawing the Fibonacci and trend lines.
Price range too close to be true!
I am drawing a chart, not making a financial decision, neither any kind of advice.
Each candle/bar is 30 min.
This is the day and the range I get by drawing the Fibonacci and trend lines.
Price range too close to be true!
I am drawing a chart, not making a financial decision, neither any kind of advice.
Trade active
The price just jumped off the trend line.Strong support at 0.035633
Trade active
Price still valid within a rangeTrade active
Price still valid within a rangeTrade active
Still bouncing between the range.Disclaimer
The information and publications are not meant to be, and do not constitute, financial, investment, trading, or other types of advice or recommendations supplied or endorsed by TradingView. Read more in the Terms of Use.
Disclaimer
The information and publications are not meant to be, and do not constitute, financial, investment, trading, or other types of advice or recommendations supplied or endorsed by TradingView. Read more in the Terms of Use.