Long
Reef - Bull flag - 200%
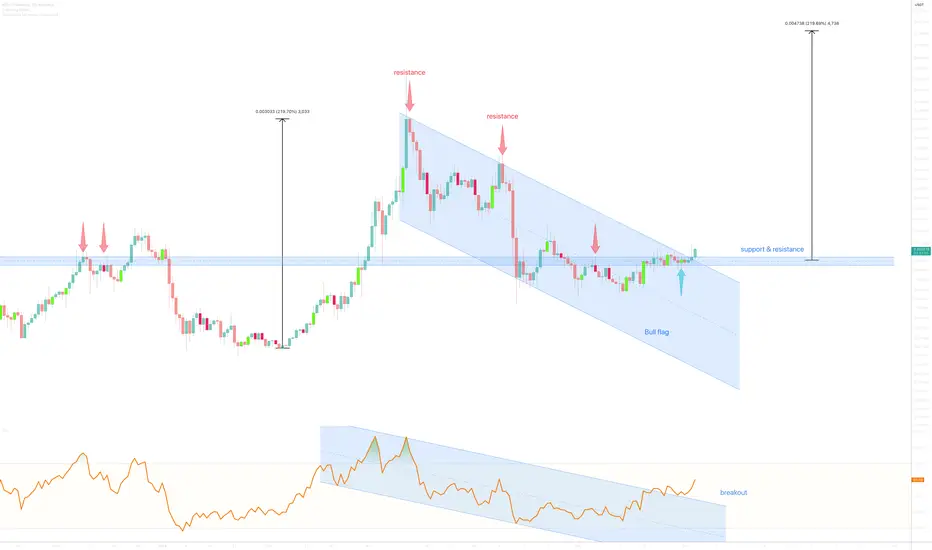
On the above 1 day chart price action has corrected 60% since early April. A number of reasons now invite a long position. They include:
1) Price action and RSI resistance breakouts.
2) Price action confirms support on past resistance. Once the horizontal 2nd the diagonal.
3) The flag. The breakout is clear to see with the flagpole extension measuring a 200% target area. Remember targets do not equal market tops.
Is it possible price action continues to correct? Sure.
Is it probable? No.
Ww
Type: Trade
Risk: <= 3%
Timeframe for long: days
Return: 200%
BTC
bc1q2eckdzh0q8vsd7swcc8et6ze7s99khhxyl7zwy
Weblink: patreon.com/withoutworries
Allow 3-6 months on ideas. Not investment advice. DYOR
bc1q2eckdzh0q8vsd7swcc8et6ze7s99khhxyl7zwy
Weblink: patreon.com/withoutworries
Allow 3-6 months on ideas. Not investment advice. DYOR
Disclaimer
The information and publications are not meant to be, and do not constitute, financial, investment, trading, or other types of advice or recommendations supplied or endorsed by TradingView. Read more in the Terms of Use.