Long
REEF - bullish divergence
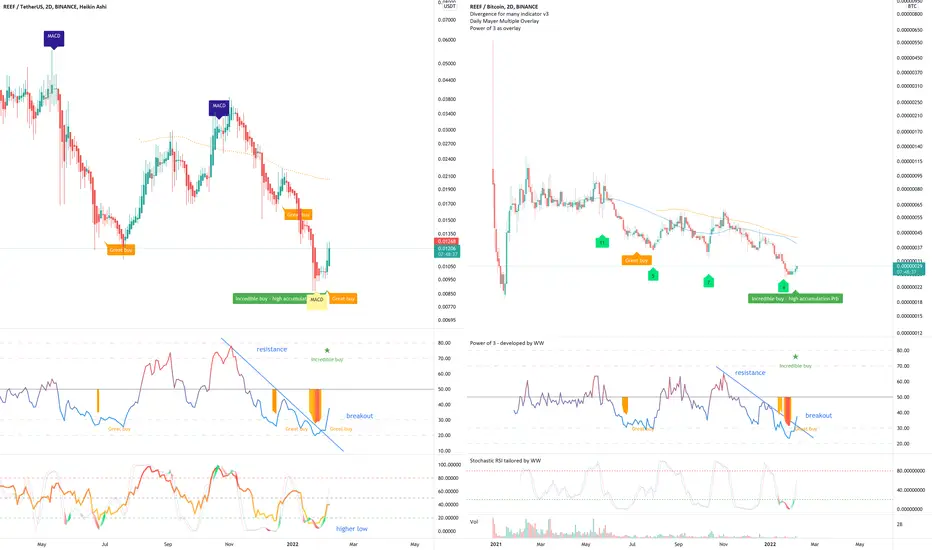
On the above 2-day charts price action on both dollar (left) and Bitcoin pairs has corrected almost 80%. Now is an excellent time to be bullish. Why?
1) Both pairs print ‘incredible buy’
2) MACD on the 2-day crosses up.
3) Both pairs print a break of RSI resistance.
4) Stochastic RSI prints regular bullish divergence with price action on the dollar chart.
Is it possible price action corrects further? For sure.
Is it probable? Very unlikely.
Good luck!
WW
Trade active
Note
11 oscillators printing bullish divergence over a 10-day period on the 2-day chart below - exciting. Think of it this way, more oscillators the further back the elastic on the catapult is pulled.BTC
bc1q2eckdzh0q8vsd7swcc8et6ze7s99khhxyl7zwy
Weblink: patreon.com/withoutworries
Allow 3-6 months on ideas. Not investment advice. DYOR
bc1q2eckdzh0q8vsd7swcc8et6ze7s99khhxyl7zwy
Weblink: patreon.com/withoutworries
Allow 3-6 months on ideas. Not investment advice. DYOR
Disclaimer
The information and publications are not meant to be, and do not constitute, financial, investment, trading, or other types of advice or recommendations supplied or endorsed by TradingView. Read more in the Terms of Use.
BTC
bc1q2eckdzh0q8vsd7swcc8et6ze7s99khhxyl7zwy
Weblink: patreon.com/withoutworries
Allow 3-6 months on ideas. Not investment advice. DYOR
bc1q2eckdzh0q8vsd7swcc8et6ze7s99khhxyl7zwy
Weblink: patreon.com/withoutworries
Allow 3-6 months on ideas. Not investment advice. DYOR
Disclaimer
The information and publications are not meant to be, and do not constitute, financial, investment, trading, or other types of advice or recommendations supplied or endorsed by TradingView. Read more in the Terms of Use.