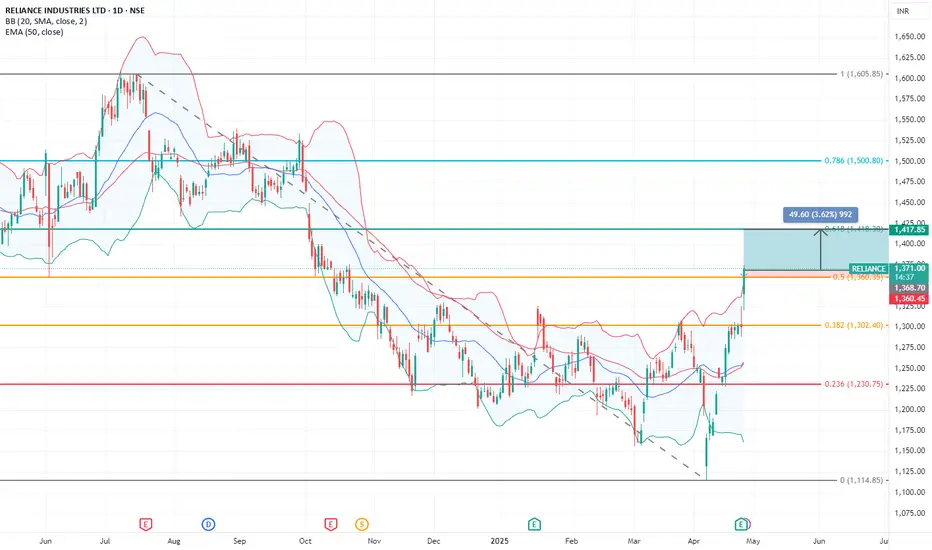
The chart provided is a daily candlestick chart for RELIANCE. Here are some key observations:
Recent Uptrend: The price has shown a significant upward movement starting in early April 2025, culminating in a recent high. This aligns with the positive sentiment following the earnings report released on April 25, 2025.
Bollinger Bands: The price has recently broken above the upper Bollinger Band, suggesting potential overbought conditions in the short term but also indicating strong upward momentum.
Moving Averages: The price is trading well above the 20-day Simple Moving Average (SMA), further confirming the uptrend. The 50-day and 200-day SMAs (not explicitly shown with values but implied by the longer-term trend) likely lie below the current price, indicating a broader bullish trend.
Fibonacci Retracement: The chart shows Fibonacci retracement levels drawn from a recent swing high around ₹1,503.85 and a swing low around ₹1,202.45. The price has currently surpassed the 0.618 Fibonacci retracement level (approximately ₹1,390).
Reasons for the Uptrend Based on the Earnings Report:
The positive uptrend is likely fueled by the following key highlights from the recent earnings report:
Strong Consolidated Performance: Both revenue and net profit showed healthy year-on-year growth for Q4 FY25 and the full financial year FY25, indicating a strong overall financial performance.
Robust Growth in Consumer Businesses: Reliance Retail and Reliance Jio demonstrated significant growth in revenue and profitability, driven by factors like store expansion, increased subscriber base, and improved ARPU. These consumer-facing businesses are key growth drivers for RIL.
Positive Outlook and Initiatives: The company's progress in new energy initiatives (solar panel and battery manufacturing) and strategic acquisitions signal future growth potential and investor confidence.
Dividend Announcement: The recommendation of a final dividend is generally viewed positively by investors.
Market Sentiment: The overall market reaction to the earnings report was positive, leading to increased buying interest in the stock.
Trading Strategies and Levels:
Based on the current chart and the positive earnings report, here are potential trading scenarios for both options and equity, along with suggested take profit (TP) and stop loss (SL) levels and risk-reward ratios.
1. Equity Trading:
Immediate Support: ₹1,368.70 (This level has acted as a recent pivot and is close to the current price).
Next Level Support: ₹1,332.40 (This level aligns with the 0.382 Fibonacci retracement and a previous consolidation area).
Immediate Resistance: ₹1,417.85 (This is the level the price is currently testing and the 0.786 Fibonacci retracement).
Next Level Resistance (Potential Take Profit 1): ₹1,503.85 (This is the previous swing high and the 1.0 Fibonacci extension of the recent move).
Potential Take Profit 2: Above ₹1,503.85 (If the upward momentum continues strongly, targeting higher Fibonacci extensions or previous all-time highs, if applicable).
Potential Long Entry: Consider a long position on a pullback towards the immediate support level of ₹1,368.70, provided there are bullish confirmation signals (e.g., a bullish candlestick pattern).
Stop Loss: Place the stop loss below the next level of support at ₹1,332.40 to limit potential losses.
Take Profit 1: ₹1,503.85
Risk-Reward Ratio (Entry at ₹1,368.70, SL at ₹1,332.40, TP at ₹1,503.85):
Risk per share = ₹1,368.70 - ₹1,332.40 = ₹36.30
Reward per share = ₹1,503.85 - ₹1,368.70 = ₹135.15
Risk-Reward Ratio = ₹135.15 / ₹36.30 ≈ 3.72 : 1 (Favorable)
2. Options Trading:
Given the bullish sentiment, traders might consider buying call options or call spreads.
Bull Call Spread:
Buy: A call option with a strike price near the current resistance level (e.g., ₹1,420 strike price expiring in the near term).
Sell: A call option with a higher strike price as the target (e.g., ₹1,500 strike price with the same expiry).
Potential Profit: Limited to the difference between the strike prices minus the net premium paid.
Maximum Loss: Limited to the net premium paid.
Stop Loss (Strategy Level): If the underlying price breaks below the immediate support level (₹1,368.70), consider exiting the spread to limit losses.
Profit Target: If the price reaches or surpasses the higher strike price (₹1,500).
Profit/Loss Ratio: This depends on the premiums paid and received. Calculate the maximum profit and maximum loss before entering the trade to assess the ratio. For example, if the net premium paid is ₹15 and the difference between strikes is ₹80, the max profit is ₹65 and the max loss is ₹15, resulting in a ratio of approximately 4.33 : 1.
Buying a Call Option:
Buy: A call option with a strike price near the current price or slightly out-of-the-money (OTM).
Potential Profit: Unlimited if the price moves significantly above the strike price.
Maximum Loss: Limited to the premium paid.
Stop Loss (Price Level): Set a stop loss on the underlying price (e.g., below the immediate support of ₹1,368.70) to protect the premium.
Take Profit: Based on the resistance levels identified (₹1,503.85 and above) or based on a target profit in terms of premium multiple.
Profit/Loss Ratio: Highly variable depending on the price movement and premium paid.
Important Considerations for Options Trading:
Time Decay (Theta): Options lose value over time, especially as they approach their expiry date. This is a crucial factor to consider, especially for short-term trades.
Volatility (Vega): Changes in implied volatility can significantly impact option prices. Earnings announcements often lead to a spike in volatility, which may decrease after the event.
Expiry Date: Choose an expiry date that aligns with your trading timeframe and expectations for the price movement.
Disclaimer:
This analysis is for informational and educational purposes only and should not be considered as financial advice. Trading in equities and options involves significant risks, and you could lose your entire investment. Always conduct your own thorough research and consult with a qualified financial advisor before making any trading decisions. The levels provided are based on the current chart and may not hold true in the future. Market conditions can change rapidly.
Trade closed: target reached
Disclaimer
The information and publications are not meant to be, and do not constitute, financial, investment, trading, or other types of advice or recommendations supplied or endorsed by TradingView. Read more in the Terms of Use.
Disclaimer
The information and publications are not meant to be, and do not constitute, financial, investment, trading, or other types of advice or recommendations supplied or endorsed by TradingView. Read more in the Terms of Use.