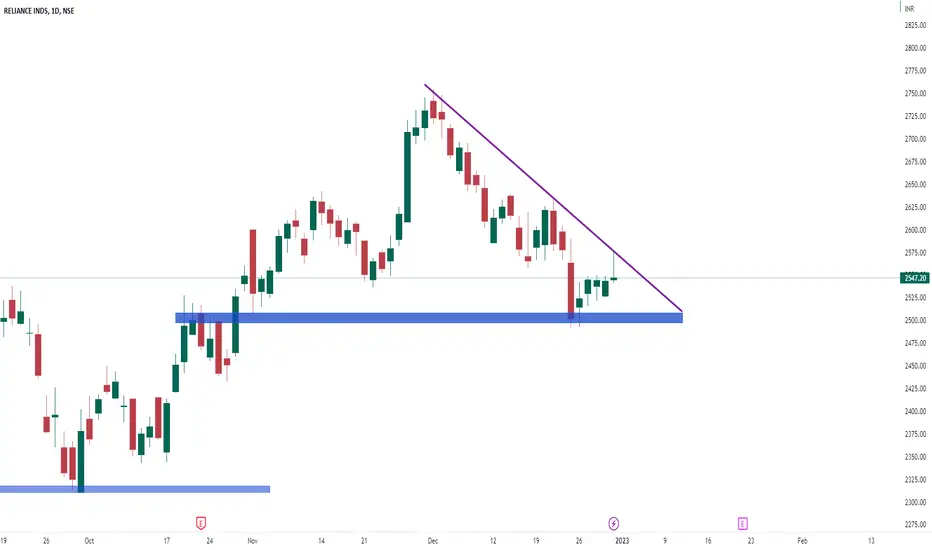
Day chart of reliance ind
it is making triangle pattern on daily chart in which important support zone is 2490 zone and Resistance is trendline
& today it is making inverse hammer candle which indicates bearish view for monday. On monday if this stocks breaks friday low then I will start shorting.
it is making triangle pattern on daily chart in which important support zone is 2490 zone and Resistance is trendline
& today it is making inverse hammer candle which indicates bearish view for monday. On monday if this stocks breaks friday low then I will start shorting.
Disclaimer
The information and publications are not meant to be, and do not constitute, financial, investment, trading, or other types of advice or recommendations supplied or endorsed by TradingView. Read more in the Terms of Use.
Disclaimer
The information and publications are not meant to be, and do not constitute, financial, investment, trading, or other types of advice or recommendations supplied or endorsed by TradingView. Read more in the Terms of Use.