📊  RELIANCE – 1H TIME FRAME ANALYSIS
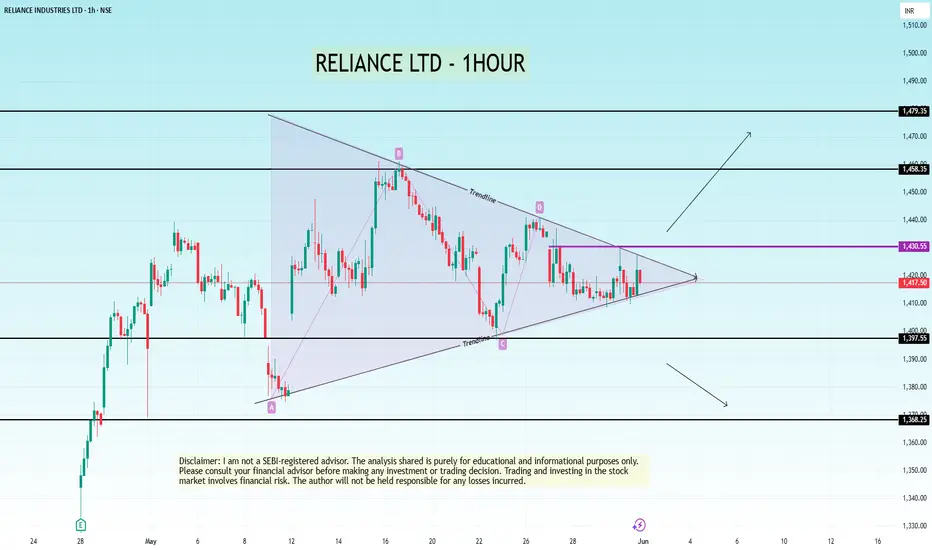
A symmetrical triangle pattern is forming on Reliance's 1-hour chart, showing a consolidation phase. This pattern is neutral in nature, meaning a breakout can occur in either direction, but the setup provides a great opportunity for a breakout trade.
The price is now at the apex of the triangle, indicating a potential breakout in the upcoming sessions. Watch for a strong move backed by volume.
TRADE PLAN :
Chart Pattern: Symmetrical Triangle
Timeframe: 1 Hour
Stock: Reliance Industries Ltd (NSE)
🔼 Long Trade (Breakout above 1430.55)
Entry: Above 1,430.55 (candle close with volume confirmation)
Target 1: 1,458.35
Target 2: 1,479.35
Stop Loss: Below 1,417
🔽 Short Trade (Breakdown below trendline):
Entry: Below triangle breakdown with strong red candle
Target 1: 1,397.55
Target 2: 1,368.25
Stop Loss: Above 1,430
Note: Avoid entering during the triangle zone. Trade only post-confirmation of breakout/breakdown with volume.
Disclaimer: This analysis is for educational purposes only. Please consult your financial advisor before making any trading decisions.
Trade active
BREAKDOWN HAPPEN AND STRONGLY TAKEN SUPPORT 1397 LEVEL LOOKS LIKE A BEAR TRAP, WAITING FOR PROPPER BREAKOUT ON DAILY TIME FRAME FOR BETTER UP SIDE MOVENote
target 1 hit lastly update about bear trade was right. perfectly reversed from the support zone
Disclaimer
The information and publications are not meant to be, and do not constitute, financial, investment, trading, or other types of advice or recommendations supplied or endorsed by TradingView. Read more in the Terms of Use.
Disclaimer
The information and publications are not meant to be, and do not constitute, financial, investment, trading, or other types of advice or recommendations supplied or endorsed by TradingView. Read more in the Terms of Use.