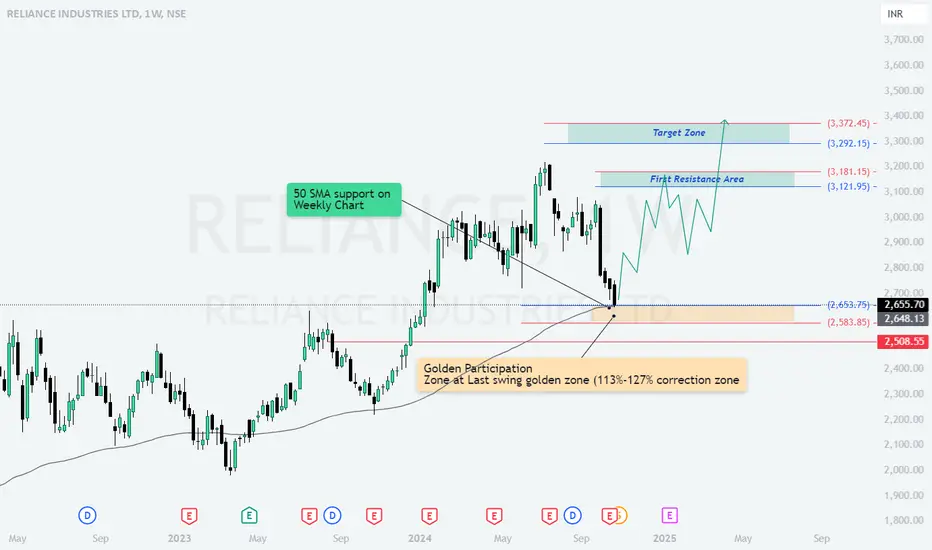
50 SMA Support Zone
The stock is currently testing support at the 50-period Simple Moving Average (SMA) on the weekly chart, a critical level that has provided support in previous corrections. This SMA often acts as a strong dynamic support, and a bounce from this area could indicate a potential upward movement.
Golden Participation Zone
The price is situated in the Golden Zone (113%-127% of the last swing correction), a Fibonacci-based support area where reversals are likely. This is often seen as a strong entry zone, with a high probability of an upside movement if support holds.
Projected Path and Resistance Areas
If the stock rebounds from the current levels, the First Resistance Area is marked between ₹3,121.95 - ₹3,181.15. Breaking through this zone would be a positive signal, potentially leading to further upside.
Target Zone
The next target zone lies between ₹3,292.15 - ₹3,372.45, aligning with the upper Fibonacci levels. This area could be the next resistance where traders might look to book profits or monitor for breakout confirmation.
Bullish Potential
The projected price path suggests a bullish movement if support at the golden zone and 50 SMA hold, indicating a reversal pattern. A strong bounce from these levels would strengthen the likelihood of a rally towards the target zone.
Disclaimer
The information and publications are not meant to be, and do not constitute, financial, investment, trading, or other types of advice or recommendations supplied or endorsed by TradingView. Read more in the Terms of Use.
Disclaimer
The information and publications are not meant to be, and do not constitute, financial, investment, trading, or other types of advice or recommendations supplied or endorsed by TradingView. Read more in the Terms of Use.