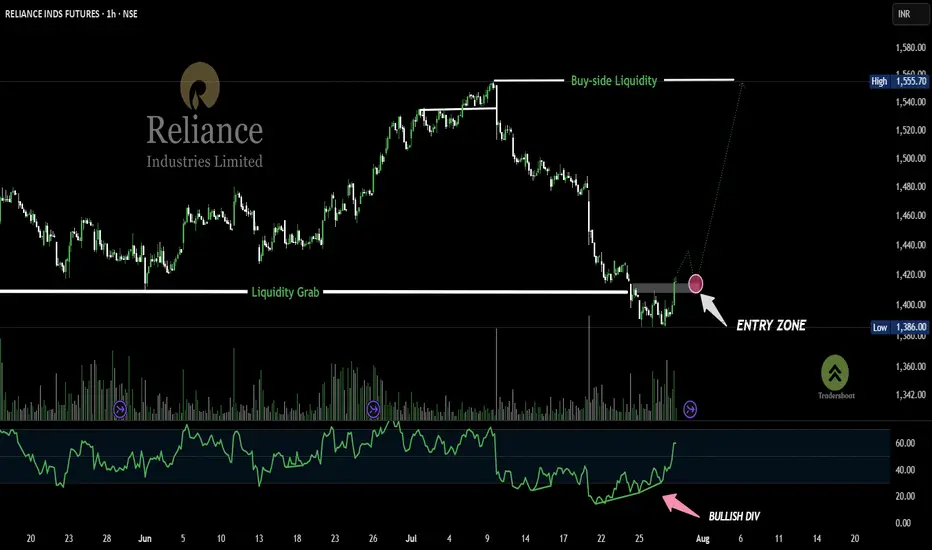
This 1H chart of RELIANCE INDS FUTURES shows a classic Smart Money Reversal Setup.
Price first executes a sweep of sell-side liquidity (marked "SWEEP") and then confirms strength with a bullish divergence in RSI 📈.
A possible retracement into the demand zone (highlighted pink circle) could offer a high-probability long entry, targeting the previous high (Buy-side Liquidity Zone).
Volume spike + RSI trend breakout = institutional accumulation signs.
Disclaimer
The information and publications are not meant to be, and do not constitute, financial, investment, trading, or other types of advice or recommendations supplied or endorsed by TradingView. Read more in the Terms of Use.
Disclaimer
The information and publications are not meant to be, and do not constitute, financial, investment, trading, or other types of advice or recommendations supplied or endorsed by TradingView. Read more in the Terms of Use.