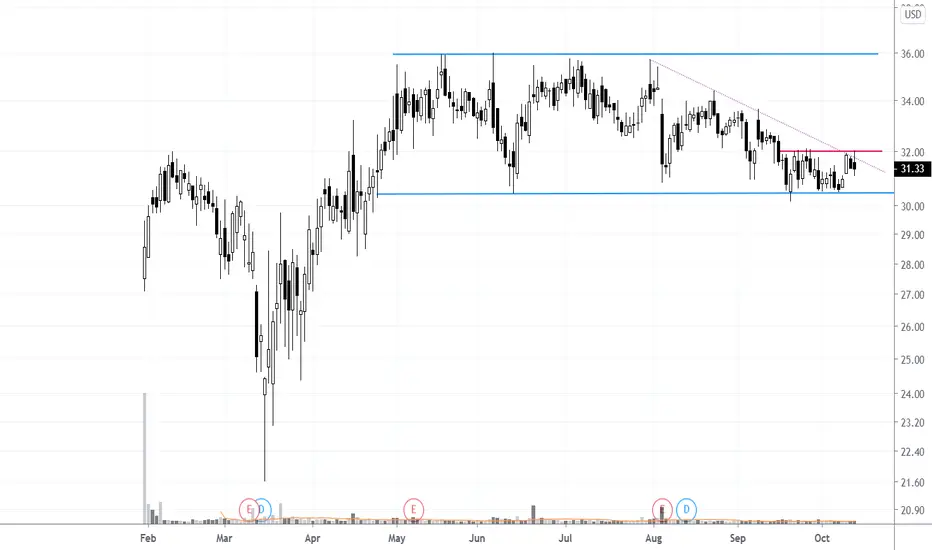
A potential close above $32 will:
1) break a 2 month down-sloping trend line (dotted red line on the chart)
2) break 1 month rectangle upper boundary resistance (red line on the chart)
3) trigger a high probability long swing trade with a target back to the 5 month rectangle upper boundary
Considering the bullish nature of this market, I am more interested to playing this on the long side vs the short scenario.
✔ Momentum & Breakout Trader Since 2006 | Influenced by Mark Minervini VCP Trading Style & William O'Neil CANSLIM 📈
✔ Follow me on Twitter @taplot - twitter.com/TaPlot
✔ YouTube channel youtube.com/@taplot
✔ Follow me on Twitter @taplot - twitter.com/TaPlot
✔ YouTube channel youtube.com/@taplot
Disclaimer
The information and publications are not meant to be, and do not constitute, financial, investment, trading, or other types of advice or recommendations supplied or endorsed by TradingView. Read more in the Terms of Use.