Is quantum computing the next big thing after artificial intelligence? We might know more soon after Rigetti Computing  RGTI reports quarterly results on Tuesday.
Let's check out RGTI's fundamental and technical picture:
Rigetti Computing's Fundamental Analysis
Quantum-computing companies are developing super-powerful computers using the physics system known as "quantum mechanics."
Quantum stocks like RGTI, D-Wave Quantum QBTS , IonQ
  IONQ and Quantum Computing
  QUBT have all swung wildly in recent months as investors try to get into the sector early on.
For instance, RGTI has risen more than 1,700% over the past 12 months, but only about 1.2% year to date.
This is not yet a profitable sector, so it's so hard to know where things are heading.
Will these companies survive as stand-alone businesses that eventually become independently viable? Or are they simply competing to be the one or two that make it to a point where they catch Big Tech's eye and become acquisition targets?
There are far more questions than answers right now regarding this high-tech industry. So, readers should understand that any investment at this early point is probably speculative in nature.
As for Rigetti, the firm operates quantum computers over the cloud, serving global enterprise, governmental and academic clients through its platform.
RGTI has developed a multi-chip quantum processor for scalable computing. The company can integrate this platform into any public or private cloud or hybrid thereof to suit a client's needs.
Rigetti will report Q2 results after the bell on Tuesday (Aug. 12). I could only find two sell-side analysts who cover the stock, and both have lowered their estimates for the company's results since quarter began.
Their consensus calls for an adjusted $0.04 loss per share on just $1.87 million of revenue. (Yes, that's million, not billion.)
Such results would compare to year-ago figures of a $0.09 adjusted loss per share on $3.09 million of revenues. That might not look so hot, but the industry isn't so hot yet.
Rigetti Computing's Technical Analysis
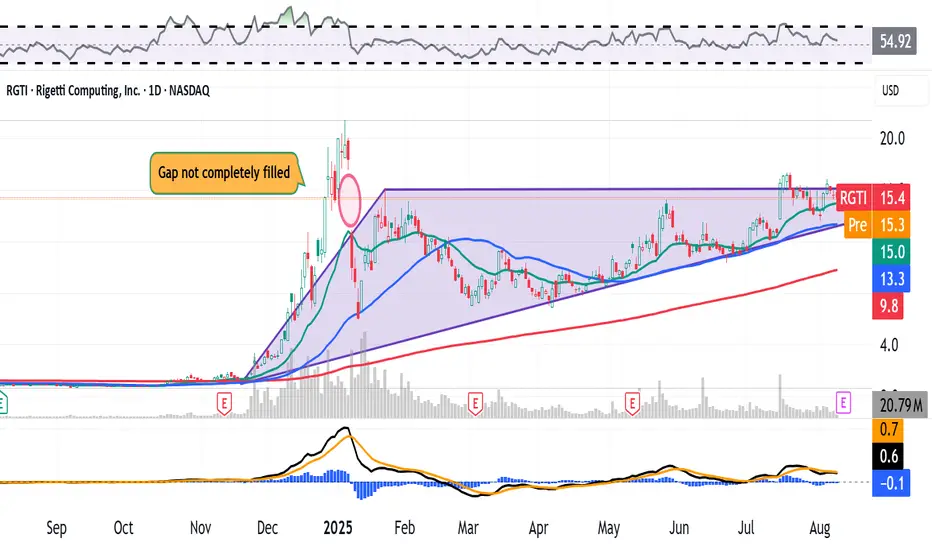
Now let's look at RGTI's chart going back 12 months:

Readers will note that after coming out of a late 2024 price spike, Rigetti gapped lower in early January, as denoted with a red oval in the chart's center.
This gap has not yet completely filled, even with the stock's recent rally in July.
Now, unfilled gaps don't always fill -- but eventually, most usually do.
What I see developing from the short consolidation period that came after that gap and into the present is what's known as an "ascending triangle" pattern (the purple field in the chart above).
This is historically a bullish pattern, where a stock generally hits resistance at or close to the same level over a period of time while continuously making higher lows. This forms the shape of a triangle, where the flat top line of resistance is the pivot.
Meanwhile, Rigetti's Relative Strength Index (the gray line at the chart's top) is better than neutral, but nowhere near being technically overbought so far.
And the stock's daily Moving Average Convergence Divergence indicator (or "MACD," marked with black and gold lines and blue bars at the chart's bottom) is not yet bullishly postured, but is close to being so.
If Rigetti breaks out from its ascending-triangle pattern, the stock's 12-day Exponential Moving Average (or "EMA," marked with a black line) could cross above its 26-day EMA (the gold line). The histogram of the 9-day EMA (the blue bars) could also go positive. All of that could be taken as technically bullish.
(Moomoo Technologies Inc. Markets Commentator Stephen “Sarge” Guilfoyle had no position in RGTI at the time of writing this column, but was long QUBT and QBTS.)
This article discusses technical analysis, other approaches, including fundamental analysis, may offer very different views. The examples provided are for illustrative purposes only and are not intended to be reflective of the results you can expect to achieve. Specific security charts used are for illustrative purposes only and are not a recommendation, offer to sell, or a solicitation of an offer to buy any security. Past investment performance does not indicate or guarantee future success. Returns will vary, and all investments carry risks, including loss of principal. This content is also not a research report and is not intended to serve as the basis for any investment decision. The information contained in this article does not purport to be a complete description of the securities, markets, or developments referred to in this material. Moomoo and its affiliates make no representation or warranty as to the article's adequacy, completeness, accuracy or timeliness for any particular purpose of the above content. Furthermore, there is no guarantee that any statements, estimates, price targets, opinions or forecasts provided herein will prove to be correct.
Moomoo is a financial information and trading app offered by Moomoo Technologies Inc. In the U.S., investment products and services on Moomoo are offered by Moomoo Financial Inc., Member FINRA/SIPC.
TradingView is an independent third party not affiliated with Moomoo Financial Inc., Moomoo Technologies Inc., or its affiliates. Moomoo Financial Inc. and its affiliates do not endorse, represent or warrant the completeness and accuracy of the data and information available on the TradingView platform and are not responsible for any services provided by the third-party platform.
Let's check out RGTI's fundamental and technical picture:
Rigetti Computing's Fundamental Analysis
Quantum-computing companies are developing super-powerful computers using the physics system known as "quantum mechanics."
Quantum stocks like RGTI, D-Wave Quantum
For instance, RGTI has risen more than 1,700% over the past 12 months, but only about 1.2% year to date.
This is not yet a profitable sector, so it's so hard to know where things are heading.
Will these companies survive as stand-alone businesses that eventually become independently viable? Or are they simply competing to be the one or two that make it to a point where they catch Big Tech's eye and become acquisition targets?
There are far more questions than answers right now regarding this high-tech industry. So, readers should understand that any investment at this early point is probably speculative in nature.
As for Rigetti, the firm operates quantum computers over the cloud, serving global enterprise, governmental and academic clients through its platform.
RGTI has developed a multi-chip quantum processor for scalable computing. The company can integrate this platform into any public or private cloud or hybrid thereof to suit a client's needs.
Rigetti will report Q2 results after the bell on Tuesday (Aug. 12). I could only find two sell-side analysts who cover the stock, and both have lowered their estimates for the company's results since quarter began.
Their consensus calls for an adjusted $0.04 loss per share on just $1.87 million of revenue. (Yes, that's million, not billion.)
Such results would compare to year-ago figures of a $0.09 adjusted loss per share on $3.09 million of revenues. That might not look so hot, but the industry isn't so hot yet.
Rigetti Computing's Technical Analysis
Now let's look at RGTI's chart going back 12 months:
Readers will note that after coming out of a late 2024 price spike, Rigetti gapped lower in early January, as denoted with a red oval in the chart's center.
This gap has not yet completely filled, even with the stock's recent rally in July.
Now, unfilled gaps don't always fill -- but eventually, most usually do.
What I see developing from the short consolidation period that came after that gap and into the present is what's known as an "ascending triangle" pattern (the purple field in the chart above).
This is historically a bullish pattern, where a stock generally hits resistance at or close to the same level over a period of time while continuously making higher lows. This forms the shape of a triangle, where the flat top line of resistance is the pivot.
Meanwhile, Rigetti's Relative Strength Index (the gray line at the chart's top) is better than neutral, but nowhere near being technically overbought so far.
And the stock's daily Moving Average Convergence Divergence indicator (or "MACD," marked with black and gold lines and blue bars at the chart's bottom) is not yet bullishly postured, but is close to being so.
If Rigetti breaks out from its ascending-triangle pattern, the stock's 12-day Exponential Moving Average (or "EMA," marked with a black line) could cross above its 26-day EMA (the gold line). The histogram of the 9-day EMA (the blue bars) could also go positive. All of that could be taken as technically bullish.
(Moomoo Technologies Inc. Markets Commentator Stephen “Sarge” Guilfoyle had no position in RGTI at the time of writing this column, but was long QUBT and QBTS.)
This article discusses technical analysis, other approaches, including fundamental analysis, may offer very different views. The examples provided are for illustrative purposes only and are not intended to be reflective of the results you can expect to achieve. Specific security charts used are for illustrative purposes only and are not a recommendation, offer to sell, or a solicitation of an offer to buy any security. Past investment performance does not indicate or guarantee future success. Returns will vary, and all investments carry risks, including loss of principal. This content is also not a research report and is not intended to serve as the basis for any investment decision. The information contained in this article does not purport to be a complete description of the securities, markets, or developments referred to in this material. Moomoo and its affiliates make no representation or warranty as to the article's adequacy, completeness, accuracy or timeliness for any particular purpose of the above content. Furthermore, there is no guarantee that any statements, estimates, price targets, opinions or forecasts provided herein will prove to be correct.
Moomoo is a financial information and trading app offered by Moomoo Technologies Inc. In the U.S., investment products and services on Moomoo are offered by Moomoo Financial Inc., Member FINRA/SIPC.
TradingView is an independent third party not affiliated with Moomoo Financial Inc., Moomoo Technologies Inc., or its affiliates. Moomoo Financial Inc. and its affiliates do not endorse, represent or warrant the completeness and accuracy of the data and information available on the TradingView platform and are not responsible for any services provided by the third-party platform.
Disclaimer
The information and publications are not meant to be, and do not constitute, financial, investment, trading, or other types of advice or recommendations supplied or endorsed by TradingView. Read more in the Terms of Use.
Disclaimer
The information and publications are not meant to be, and do not constitute, financial, investment, trading, or other types of advice or recommendations supplied or endorsed by TradingView. Read more in the Terms of Use.