Short-Term Outlook: Bearish
The strong sell-off and high volume indicate significant bearish momentum. Unless the price reclaims $12.00, the overall trend remains bearish.
Oversold Bounce Possible
Given the recent sharp decline, a short-term bounce is possible if $10.33 holds. However, such a bounce may be short-lived unless backed by strong buying volume.
Key Levels to Watch
The $10.33 POC is crucial. If this level fails, a move toward $8.00 or even $6.21 is likely.
On the upside, breaking above $12.00 with volume could trigger a move toward $15.00.
Speculative Nature
Like IONQ, RGTI is a speculative stock with high volatility. Quick and large price swings are likely, so it’s important to manage position sizes and use tight stop-losses to minimize risk.
Sentiment
While there’s potential for recovery in the long term, the short-term bias remains bearish unless the price reclaims key levels. Caution is advised.
1. Current Market Structure
* Trend Analysis:
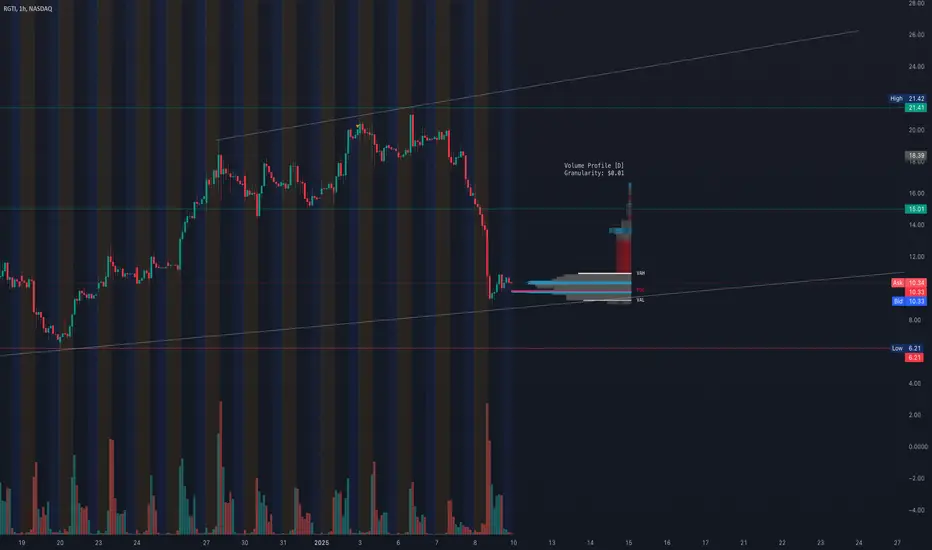
* RGTI is in a clear downtrend, with a significant sell-off breaking key levels. The sharp decline indicates strong bearish momentum.
* The price is now consolidating near $10.33, which aligns with a key support level based on the Point of Control (POC) from the volume profile.
* Volume Profile Observations:
* Point of Control (POC): $10.33 – This is the most traded price level recently, acting as a key pivot point.
* Value Area High (VAH): $15.00 – A major resistance zone for any potential recovery.
* Value Area Low (VAL): $6.21 – This is the lower bound of the volume range and a critical support level to watch if the price breaks down further.
2. Key Levels to Watch
Support Levels:
1. $10.00–$10.33 (POC Zone):
* Immediate support. A breakdown below this level could lead to further downside.
2. $8.00:
* Historical support zone where price might stabilize temporarily.
3. $6.21 (VAL):
* The last significant support where buyers could step in.
Resistance Levels:
1. $12.00:
* The first level of resistance where sellers may reappear.
2. $15.00 (VAH):
* A key resistance zone; breaking this level would suggest a potential shift to bullish sentiment.
3. $18.00:
* A major level to target if the stock shows significant recovery momentum.
Disclaimer
The information and publications are not meant to be, and do not constitute, financial, investment, trading, or other types of advice or recommendations supplied or endorsed by TradingView. Read more in the Terms of Use.
Disclaimer
The information and publications are not meant to be, and do not constitute, financial, investment, trading, or other types of advice or recommendations supplied or endorsed by TradingView. Read more in the Terms of Use.