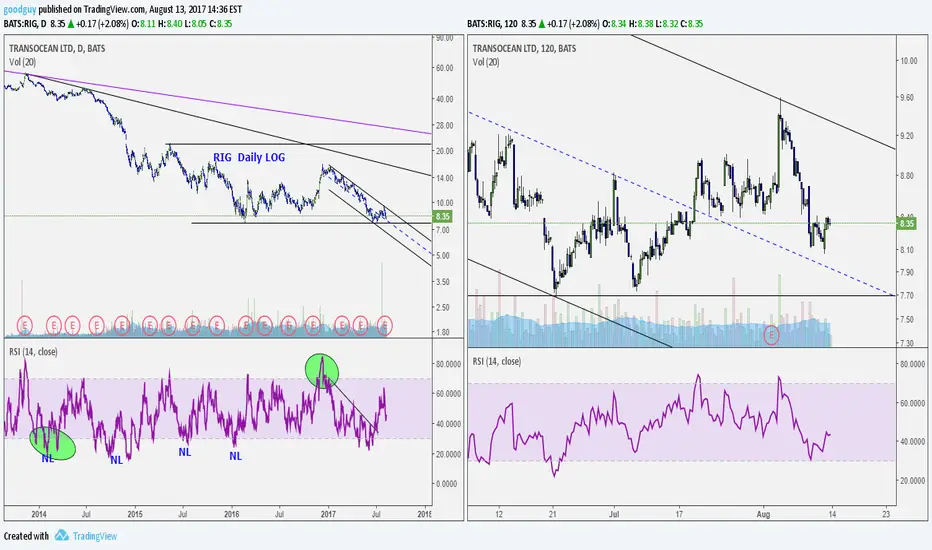
Some chartist have observed that the RSI (14) tends to move in ranges. Notice in the daily RSI that the value until 2014 stays at or above the low range on dips. Then it goes way below the line in 2014. Some chartists would see that as a sign that the winds have chaged and a bear market may be starting, which it was. The high of the daily RSI never went above the normal range until 2014 when it went way up. Was this a sign the winds have changed again? Before this there were a series of new lows in price {NL) but so far not since.
Encouraging article :
seekingalpha.com/article/4098486-transocean-evidence-suggests-offshore-recovery-now-begun-stock-lags-behind?auth_param=lc65:1cp14ft:2d4573419657a2fc75807aa4eb8c5047&uprof=46
Encouraging article :
seekingalpha.com/article/4098486-transocean-evidence-suggests-offshore-recovery-now-begun-stock-lags-behind?auth_param=lc65:1cp14ft:2d4573419657a2fc75807aa4eb8c5047&uprof=46
Note
Correction: "never went much above the normal range until 2017" when it went way up.Note
Surprising day to me. But noticed just went below the previous low for a moment right ar the midline of the down channel. Have to see what happens over the next couple of days.
Trade closed: stop reached
Disclaimer
The information and publications are not meant to be, and do not constitute, financial, investment, trading, or other types of advice or recommendations supplied or endorsed by TradingView. Read more in the Terms of Use.
Disclaimer
The information and publications are not meant to be, and do not constitute, financial, investment, trading, or other types of advice or recommendations supplied or endorsed by TradingView. Read more in the Terms of Use.