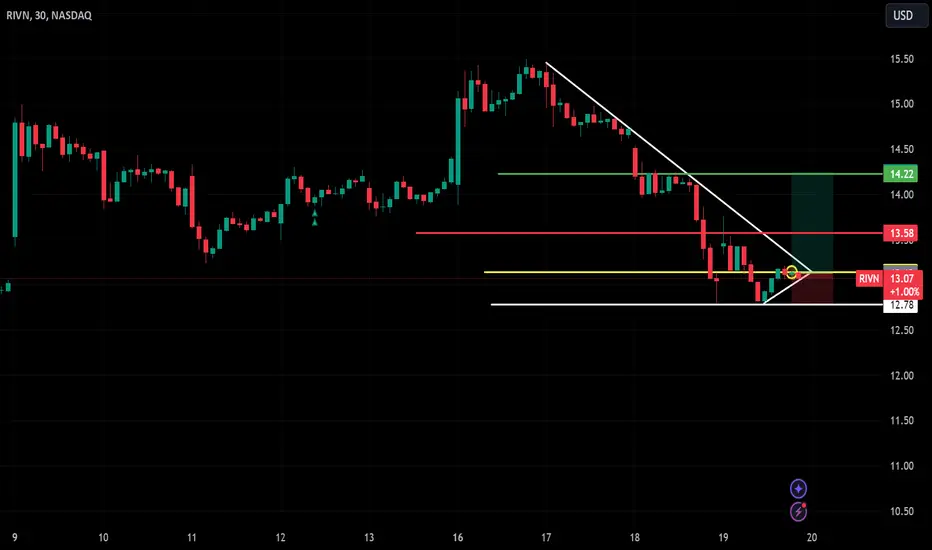
The 30-minute chart for RIVN highlights a potential descending triangle breakout, signaling a possible trend reversal:
Entry: $13.14 (yellow line - breakout level).
Stop Loss (SL): $12.78 (white line - key support).
Target 1 (T1): $13.58 (red line - first resistance).
Target 2 (T2): $14.22 (green line - major resistance).
The price is attempting to break out of the descending triangle with increasing momentum. Monitor for confirmation at $13.14.
#RIVN #StockMarket #TradingSetup #TechnicalAnalysis #NASDAQ
Disclaimer
The information and publications are not meant to be, and do not constitute, financial, investment, trading, or other types of advice or recommendations supplied or endorsed by TradingView. Read more in the Terms of Use.
Disclaimer
The information and publications are not meant to be, and do not constitute, financial, investment, trading, or other types of advice or recommendations supplied or endorsed by TradingView. Read more in the Terms of Use.