Space-services company Rocket Lab  RKLB , which has seen its stock shoot up by more than 75% year to date and 800%+ over the past 12 months, will report its latest quarterly earnings next Thursday. Does RKLB's chart show the company has more altitude to gain ... or will it crash back to Earth?
Let's check things out:
Rocket Lab's Fundamental Analysis
For those of you unfamiliar with RKLB, it's a Long Beach, Calif.-based end-to-end space company. (Full disclosure: I own shares in the name.)
Rocket Lab designs and manufactures its own small- and medium-class rockets in order to provide launch services from its sites, which are primarily in Virginia and New Zealand.
The company has mostly had commercial customers since its founding, but is starting to get some traction providing these services to the U.S. government for national-security purposes. You might say the firm competes with Tesla chief Elon Musk's privately held SpaceX and Amazon founder Jeff Bezos' private Blue Origin firm, just on a smaller scale.
RKLB is set to release Q2 results after the bell on Aug. 7, with the Street looking for a $0.07 adjusted loss per share on $135.3 million of revenue.
That would represent a 27.3% revenue gain from the $106.3 million the company took in during the same period last year, although profitability would have eased from the $0.05 adjusted loss per share RKLB posted in Q2 2024.
Of the seven sell-side analysts that I found that cover the stock, three have increased their earnings estimates since the quarter began, three have cut their estimates and one has sat on his hands.
Notably, Jeff Van Rhee of Craig-Hallum this week initiated Rocket Lab with a "Hold" rating and a $51 target price (vs. the $45.30 the stock was trading at Friday afternoon).
Looking further ahead, analysts expect Rocket Lab's revenues to grow 32% for 2025 as a whole, followed by another 56% for all of 2026.
As for price action, Rocket Lab's shares have traded more volatilely as the firm approaches its earnings release. After spiking into mid-July on an almost parabolic run, RKLB has recently consolidated with a number of days that saw multi-percentage-point drops.
As of Wednesday, options markets were pricing in a 50% likelihood of a move greater than 13%.
Rocket Lab's Technical Analysis
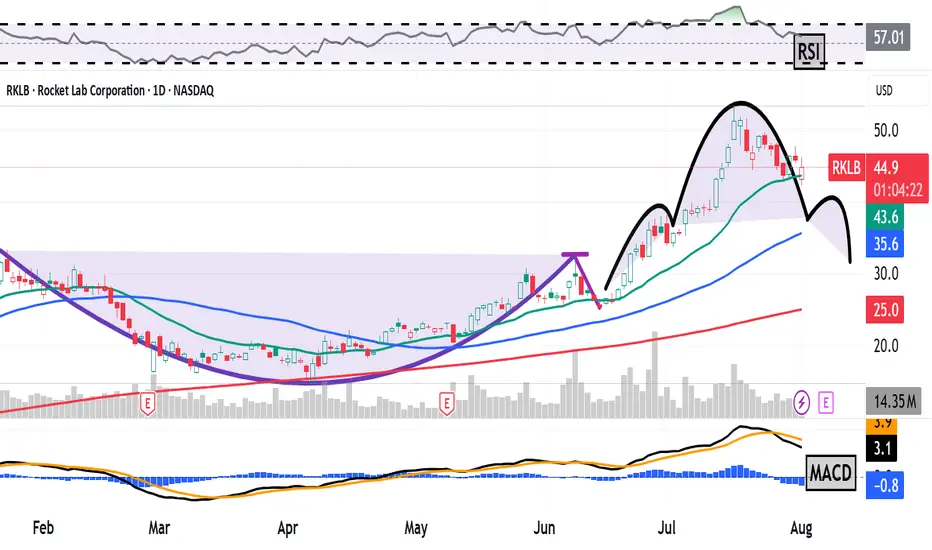
Now let's look at RKLB's chart going back to December:

Readers will note that since Rocket Lab ended its sharp upward run in mid-July, the stock's Relative Strength Index (the gray line at the chart's top) has exited overbought territory -- although the RSI still remains healthy.
Readers will also see that within the daily Moving Average Convergence Divergence indicator (marked "MACD" at the chart's bottom), the histogram of the stock's 9-day Exponential Moving Average (or "EMA," denoted by blue bars) has entered negative territory. That's usually short-term bearish.
Meanwhile, Rocket Lab's 12-day EMA (the black line near the chart's bottom) has also crossed below its 26-day EMA (the gold line). This is also traditionally a bearish signal.
However, one positive for the RKLB is that the stock appears to have found support in recent days at its 21-day EMA (the green line above). This suggests a willingness of swing traders to support the stock at that line.
Still, Rocket Lab's chart is showing what looks like a completed "head-and-shoulders" pattern of bearish reversal at the chart's right (denoted by curving black lines).
Should this pattern foretell a sell-off (as the daily MACD seems set up for), Rocket Lab's downside pivot would likely show up as a neckline at around $37 a share. That's well below the $45.30 that RKLB was trading at Friday afternoon.
What if Rocket Lab fails to hold its 21-day EMA ($45.90 in the chart above)? In that case, both the 50-day Simple Moving Average (or "SMA," marked with a blue line) and 200-day SMA (the red line) would have to come into play for the pattern implied here to become fully realized.
(Moomoo Technologies Inc. Markets Commentator Stephen “Sarge” Guilfoyle was long RKLB the time of writing this column.)
This article discusses technical analysis, other approaches, including fundamental analysis, may offer very different views. The examples provided are for illustrative purposes only and are not intended to be reflective of the results you can expect to achieve. Specific security charts used are for illustrative purposes only and are not a recommendation, offer to sell, or a solicitation of an offer to buy any security. Past investment performance does not indicate or guarantee future success. Returns will vary, and all investments carry risks, including loss of principal. This content is also not a research report and is not intended to serve as the basis for any investment decision. The information contained in this article does not purport to be a complete description of the securities, markets, or developments referred to in this material. Moomoo and its affiliates make no representation or warranty as to the article's adequacy, completeness, accuracy or timeliness for any particular purpose of the above content. Furthermore, there is no guarantee that any statements, estimates, price targets, opinions or forecasts provided herein will prove to be correct.
Moomoo is a financial information and trading app offered by Moomoo Technologies Inc. In the U.S., investment products and services on Moomoo are offered by Moomoo Financial Inc., Member FINRA/SIPC.
TradingView is an independent third party not affiliated with Moomoo Financial Inc., Moomoo Technologies Inc., or its affiliates. Moomoo Financial Inc. and its affiliates do not endorse, represent or warrant the completeness and accuracy of the data and information available on the TradingView platform and are not responsible for any services provided by the third-party platform.
Let's check things out:
Rocket Lab's Fundamental Analysis
For those of you unfamiliar with RKLB, it's a Long Beach, Calif.-based end-to-end space company. (Full disclosure: I own shares in the name.)
Rocket Lab designs and manufactures its own small- and medium-class rockets in order to provide launch services from its sites, which are primarily in Virginia and New Zealand.
The company has mostly had commercial customers since its founding, but is starting to get some traction providing these services to the U.S. government for national-security purposes. You might say the firm competes with Tesla chief Elon Musk's privately held SpaceX and Amazon founder Jeff Bezos' private Blue Origin firm, just on a smaller scale.
RKLB is set to release Q2 results after the bell on Aug. 7, with the Street looking for a $0.07 adjusted loss per share on $135.3 million of revenue.
That would represent a 27.3% revenue gain from the $106.3 million the company took in during the same period last year, although profitability would have eased from the $0.05 adjusted loss per share RKLB posted in Q2 2024.
Of the seven sell-side analysts that I found that cover the stock, three have increased their earnings estimates since the quarter began, three have cut their estimates and one has sat on his hands.
Notably, Jeff Van Rhee of Craig-Hallum this week initiated Rocket Lab with a "Hold" rating and a $51 target price (vs. the $45.30 the stock was trading at Friday afternoon).
Looking further ahead, analysts expect Rocket Lab's revenues to grow 32% for 2025 as a whole, followed by another 56% for all of 2026.
As for price action, Rocket Lab's shares have traded more volatilely as the firm approaches its earnings release. After spiking into mid-July on an almost parabolic run, RKLB has recently consolidated with a number of days that saw multi-percentage-point drops.
As of Wednesday, options markets were pricing in a 50% likelihood of a move greater than 13%.
Rocket Lab's Technical Analysis
Now let's look at RKLB's chart going back to December:
Readers will note that since Rocket Lab ended its sharp upward run in mid-July, the stock's Relative Strength Index (the gray line at the chart's top) has exited overbought territory -- although the RSI still remains healthy.
Readers will also see that within the daily Moving Average Convergence Divergence indicator (marked "MACD" at the chart's bottom), the histogram of the stock's 9-day Exponential Moving Average (or "EMA," denoted by blue bars) has entered negative territory. That's usually short-term bearish.
Meanwhile, Rocket Lab's 12-day EMA (the black line near the chart's bottom) has also crossed below its 26-day EMA (the gold line). This is also traditionally a bearish signal.
However, one positive for the RKLB is that the stock appears to have found support in recent days at its 21-day EMA (the green line above). This suggests a willingness of swing traders to support the stock at that line.
Still, Rocket Lab's chart is showing what looks like a completed "head-and-shoulders" pattern of bearish reversal at the chart's right (denoted by curving black lines).
Should this pattern foretell a sell-off (as the daily MACD seems set up for), Rocket Lab's downside pivot would likely show up as a neckline at around $37 a share. That's well below the $45.30 that RKLB was trading at Friday afternoon.
What if Rocket Lab fails to hold its 21-day EMA ($45.90 in the chart above)? In that case, both the 50-day Simple Moving Average (or "SMA," marked with a blue line) and 200-day SMA (the red line) would have to come into play for the pattern implied here to become fully realized.
(Moomoo Technologies Inc. Markets Commentator Stephen “Sarge” Guilfoyle was long RKLB the time of writing this column.)
This article discusses technical analysis, other approaches, including fundamental analysis, may offer very different views. The examples provided are for illustrative purposes only and are not intended to be reflective of the results you can expect to achieve. Specific security charts used are for illustrative purposes only and are not a recommendation, offer to sell, or a solicitation of an offer to buy any security. Past investment performance does not indicate or guarantee future success. Returns will vary, and all investments carry risks, including loss of principal. This content is also not a research report and is not intended to serve as the basis for any investment decision. The information contained in this article does not purport to be a complete description of the securities, markets, or developments referred to in this material. Moomoo and its affiliates make no representation or warranty as to the article's adequacy, completeness, accuracy or timeliness for any particular purpose of the above content. Furthermore, there is no guarantee that any statements, estimates, price targets, opinions or forecasts provided herein will prove to be correct.
Moomoo is a financial information and trading app offered by Moomoo Technologies Inc. In the U.S., investment products and services on Moomoo are offered by Moomoo Financial Inc., Member FINRA/SIPC.
TradingView is an independent third party not affiliated with Moomoo Financial Inc., Moomoo Technologies Inc., or its affiliates. Moomoo Financial Inc. and its affiliates do not endorse, represent or warrant the completeness and accuracy of the data and information available on the TradingView platform and are not responsible for any services provided by the third-party platform.
Disclaimer
The information and publications are not meant to be, and do not constitute, financial, investment, trading, or other types of advice or recommendations supplied or endorsed by TradingView. Read more in the Terms of Use.
Disclaimer
The information and publications are not meant to be, and do not constitute, financial, investment, trading, or other types of advice or recommendations supplied or endorsed by TradingView. Read more in the Terms of Use.