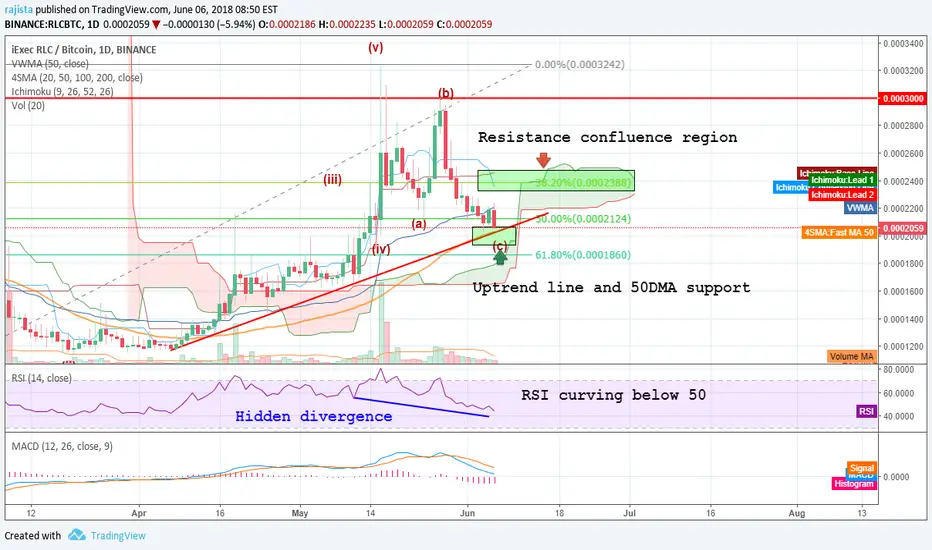
#RLC after forming a bearish reversal pattern i.e bearish butterfly around the 30ksats resistance, has dropped over 30%.
Currently doing an ABC ZIg-Zag with c point expected to be: 18.5-20ksats, at the uptrend line support and 61.8fib region.
Bearish Ts-Ks crossover in 1D t-f
50DMA resistance: 20.3k sats
RSI: bearish, curving below 50,
however there's hidden bullish divergence indicating the downside momentum is now weakening.
In 4H t-f
RLC is below the cloud and facing strong resistance from 20k-24ksats region.
Bullsih view: If we get confirmation of price reversal around the 18.5-20ksats region i.e at the uptrend line support and 61.8fib region.
Bearish view: If rlc breaks below the uptrend line then next support level is at the 100DMA support: 16.5k sats
Note
RLC went bearish and broke below the uptrend line and 50DMA support, currently it is supported by 100DMA at 16.7k sats region.If Rlc doesn't manage to sustain above the 100DMA level then next level of support is at the 78.6fib at 15k sats
Disclaimer
The information and publications are not meant to be, and do not constitute, financial, investment, trading, or other types of advice or recommendations supplied or endorsed by TradingView. Read more in the Terms of Use.
Disclaimer
The information and publications are not meant to be, and do not constitute, financial, investment, trading, or other types of advice or recommendations supplied or endorsed by TradingView. Read more in the Terms of Use.