Long
RLC to $150
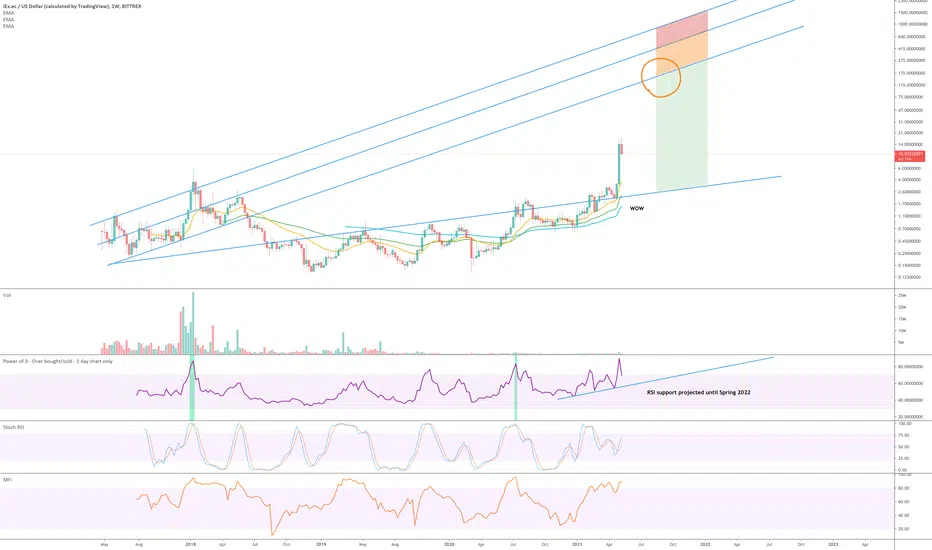
Following the break of $7 and a new weekly high it is time to consider new targets.
Looking left on the above weekly chart the targets with he most confluence that I can identify are shown in the traffic like colours, with $150 being the most conservative. 10-15x from here depending on which exchange you look at!
Is there anything else to support such a large move? Yes. The monthly chart below, (I published a week back or so for my month of May picks). The monthly chart continues to look amazing with Stochastic RSI above 80 - very bullish.
In the near term $17 is the target we should watch closely, support on here would be a clear signal to $150.
If you can stomach the volatility until the end of the year you might see a far higher target around $600.
Good luck!
WW
Note
Interesting article just published. Considering RLX market capital is not 1/20th of the Chainlink, there be lots of room to play in this growing oracle space. Especially if it is easier to use."Upcoming Launch: The iExec Oracle Factory
A new user interface, the iExec Oracle Factory, will be released in the coming months. The Oracle Factory product will allow anyone to create their own oracles from scratch in just 5 minutes, and directly from their browser!
Here are some of the initial features planned:
Build Oracles using Preset APIs: anyone can build an oracle based on presets (e.g Yahoo Finance stocks API or the TESLA stock price). In 5 minutes, without any blockchain knowledge, you will be able to deploy an oracle using one of the presets. You will get a unique link to share your oracle creation."
medium.com/iex-ec/iexec-project-update-april-974ce41e15d5
Note
Receiving a lot private messages asking me if the target is now cancelled.No.
Emotions are a money killer. I guarantee you those that are thinking of selling now are the same ones that bought in around $15.
When the last target was reached ($7.20) it became support. I can't say for 100% it will be support when tested but I'm 95% confident it will become support based on the weekly chart above.
Be patient.
Trade active
It might not feel like it but this is a perfect long entry point.Note
Pennant formation in price action on daily chart. Flagpole extension suggests a target of $21.Trade active
It might not feel like it but this is a perfect long entry point. The 2nd time in as many days.Trade active
2.5 years later RLC price action (on the 2-day chart below) breaks through resistance from the December 2018 lows. Just as Bitcoin did recently at $14k before going on a parabolic run. If you look closely you can see buyers have stepped in (long wick) on support.Additionally the hash ribbon has just printed a ‘buy signal’. Look left - this is a reliable long signal.
Note
At times of huge volatility opportunities open up. Corrective wave on RLC appears to be complete on the 4-hour chart:Trade active
Fantastic - that's the signal we want to see. Past resistance confirming support, especially as the Stocahstic RSI remains under 20, oversold.Additionally the Hash Ribbon just printed a 'buy' signal (circled in orange) - look left to see previous.
Trade active
After 24-days Stochastic RSI crosses up 20. The journey to $14 resistance ist unterwegs!Trade active
Three bullish observations:1) Price action lands on the 21-week EMA (yellow line).
2) Price action is now testing the previous January 2018 high as support.
3) RSI testing 50 level (circled in green). A bounce from here would be very bullish for price action.
Note
There's a good probability price action has now bottomed out.Price action has now landed on a lowest golden ratio multiplier (red line). Look left for previous times price action landed on this fib level (circled in green).
What does it tell you? Sellers have over extended themselves, by some considerable margin. Just as buyers had done a month before for the rush to $15 when the upper band was hit.
If you bought in the last month and are now thinking of selling - I’d say look again, look left - there is 4 recent data points telling you that would be a mistake of high probability!
Be patient.
Trade active
A golden opportunity - maximum market fear at the moment as price action corrects the most in its history following a rally. A 85% correction is the deepest of the previous. Look left following the correction.
Price action is currently testing the annual EMA at the same time as the previous market high in January 2018.
Trade active
Note
On the 10-chart below price action confirms RSI support from recent 'great sell' signal.Does price action reach target with this next wave? Maybe - time will tell.
Trade active
As before the golden cross (blue highlight) followed by a test of the 200-day EMA (purple circles).Note
When things seems their worst it is often a signal for a opportunity.On the daily chart below price action is on yearly EMA. The last recent touches are circled in purple - look left.
Lastly the falling wedge in price action, this is very bullish. Once it breaks out, 2-3 weeks from now price action will be back where is was 2-weeks ago.
A good moment to take some time out.
Note
Unfortunately the Bittrex exchange deleted all the data I was using for this analysis. Data science is my thing and Binance has limited history. Have created this dollar pair from the Upbit exchange.On the weekly chart below price action is testing the 50-week EMA (green line). Price action closing @ $4 would be a strong signal for upside continuation. The last higher low was printed on the 50-week EMA, just as is now being tested.
Be patient. I know it’s tough, especially if you entered around $14. Wir Schaffen das.
WW
Note
Looking fantastic. Price action bounces off last market top. Be patience.Trade active
Price action breaks out of resistance (purple circle)Note
Someone below asked for an update.One significant development is the confirmation of support on past resistance as shown on the 10-day chart below. Be patient.
Note
On the daily line chart below 9 oscillators are currently showing bullish divergence with price action. Look left!Trade active
Remember that scene from total recall 'get ready fora surprise?'This is the monthly chart. The surprise comes once this ascending triangle breaks out.
Note
For the moment a 'great buy' signal is printing on the daily with multiple oscillators printing bullish divergence.When $5 is recovered ask me below for an update. So much depends on that level.
Note
The weekly BTC pair is exciting... Do you see the trend? Higher highs higher lows.Price action is currently:
1) Testing support on the past resistance.
2) Testing golden ratio 0.618 as support.
Chill, it's all good.
Trade active
Just noticed, a 'incredible buy' prints on the daily chart during the last week.Note
A 4-day chart of price action currently testing the annual moving average (thick green line). If the green line is broken with a candle body, I'll close this trade. If a bounce is seen, expect price action to move to the upper channel resistance.Note
There was a 'incredible buy' signal recently printed on the 3-dayNote
Just noticed the 4-day BTC pair volume weighted average with a 'great buy' signal.Note
Signal on the BTC pair converted as it has done twice before Note
2-day dollar chart in the last week had buy signals on it but wasn't looking.Note
3-day chart bullish divergence Note
Price action bounces off the 2-day / 50-day SMA BTC
bc1q2eckdzh0q8vsd7swcc8et6ze7s99khhxyl7zwy
Weblink: patreon.com/withoutworries
Allow 3-6 months on ideas. Not investment advice. DYOR
bc1q2eckdzh0q8vsd7swcc8et6ze7s99khhxyl7zwy
Weblink: patreon.com/withoutworries
Allow 3-6 months on ideas. Not investment advice. DYOR
Disclaimer
The information and publications are not meant to be, and do not constitute, financial, investment, trading, or other types of advice or recommendations supplied or endorsed by TradingView. Read more in the Terms of Use.
BTC
bc1q2eckdzh0q8vsd7swcc8et6ze7s99khhxyl7zwy
Weblink: patreon.com/withoutworries
Allow 3-6 months on ideas. Not investment advice. DYOR
bc1q2eckdzh0q8vsd7swcc8et6ze7s99khhxyl7zwy
Weblink: patreon.com/withoutworries
Allow 3-6 months on ideas. Not investment advice. DYOR
Disclaimer
The information and publications are not meant to be, and do not constitute, financial, investment, trading, or other types of advice or recommendations supplied or endorsed by TradingView. Read more in the Terms of Use.