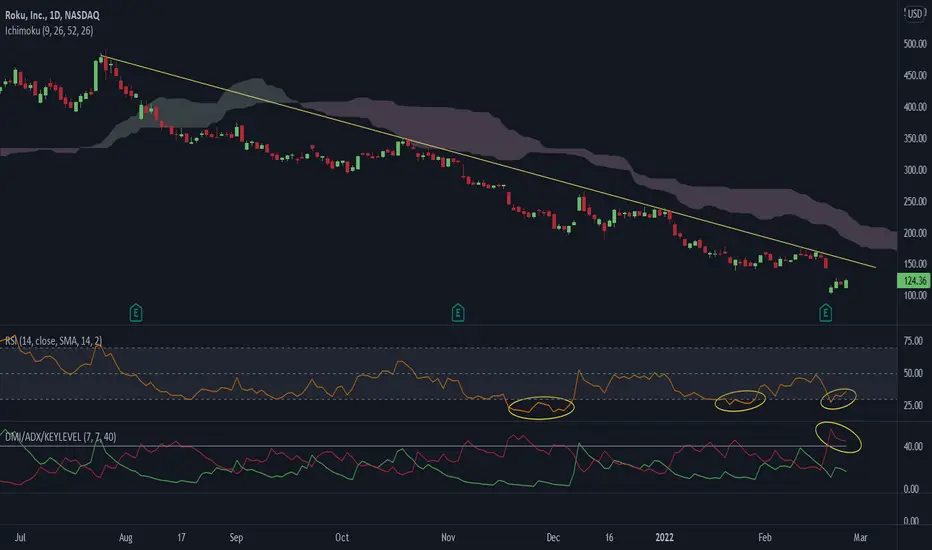
There are two trades here. One is a move back up to the yellow line. Next, if the line breaks, is a longer duration move up to 200+.
The yellow ovals mark three "waves" into oversold RSI and each one has gotten smaller.
Also note directional selling is over 40 and as this red line lowers and sellers come back in, price should get a boost.
The yellow ovals mark three "waves" into oversold RSI and each one has gotten smaller.
Also note directional selling is over 40 and as this red line lowers and sellers come back in, price should get a boost.
Disclaimer
The information and publications are not meant to be, and do not constitute, financial, investment, trading, or other types of advice or recommendations supplied or endorsed by TradingView. Read more in the Terms of Use.
Disclaimer
The information and publications are not meant to be, and do not constitute, financial, investment, trading, or other types of advice or recommendations supplied or endorsed by TradingView. Read more in the Terms of Use.
