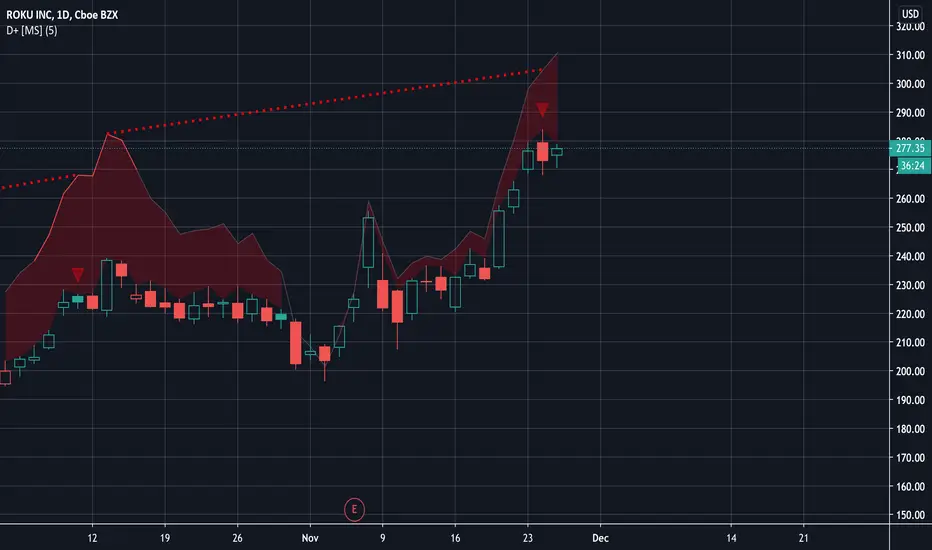
This chart speaks the loudest and is the most clear for predicting the future of Rokus movement. Look at the last 5 candles. The candles body for candle 5 4 and 3 get smaller and smaller as it moves up. Then we have a bear candle for candle number 2. This candle triggered a sell signal on the daily. Sell signals do not appear on the daily candle often. Now, if you look at the last candle, todays candle, it has a really small body and a large bear wick. Based on this low hanging bear wick and a bear candle before it, we can expect the next candle to be a bear candle. Possibly larger than the previous. So based on this chart alone, this is why I have made my decision to continue holding my position.
Note
Roku has kicked my butt, my first big loss trading options. A great learning experience though.Disclaimer
The information and publications are not meant to be, and do not constitute, financial, investment, trading, or other types of advice or recommendations supplied or endorsed by TradingView. Read more in the Terms of Use.
Disclaimer
The information and publications are not meant to be, and do not constitute, financial, investment, trading, or other types of advice or recommendations supplied or endorsed by TradingView. Read more in the Terms of Use.