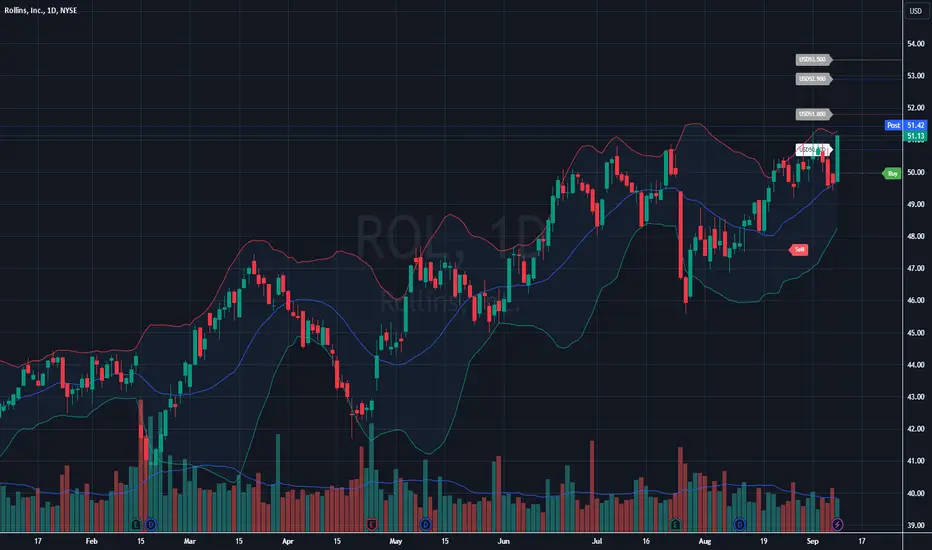
Price Action :
Bollinger Bands :
Volume :
Key Support and Resistance :
Trend :
Conclusion :
- The price recently bounced off the lower Bollinger Band, suggesting it may have found support near $49.00.
Bollinger Bands :
- The price is moving towards the upper Bollinger Band, indicating bullish momentum.
Volume :
- There has been a slight increase in volume accompanying the recent price rise, which can be a bullish sign of commitment from buyers.
Key Support and Resistance :
- Support: Around $49.00 (recent low and moving average level).
- Resistance: $52.00, which acted as a resistance level previously. A break above this level could trigger a further rally.
Trend :
- The short-term trend is bullish, as the price is climbing steadily towards the previous highs.
Conclusion :
- The stock is showing strength as it approaches a key resistance at $52.00. A breakout with volume would be a bullish signal for further upside. However, if it fails to break this level, there could be a pullback towards the $49.00 support level.
➀➁➂➃➄
Disclaimer
The information and publications are not meant to be, and do not constitute, financial, investment, trading, or other types of advice or recommendations supplied or endorsed by TradingView. Read more in the Terms of Use.
➀➁➂➃➄
Disclaimer
The information and publications are not meant to be, and do not constitute, financial, investment, trading, or other types of advice or recommendations supplied or endorsed by TradingView. Read more in the Terms of Use.