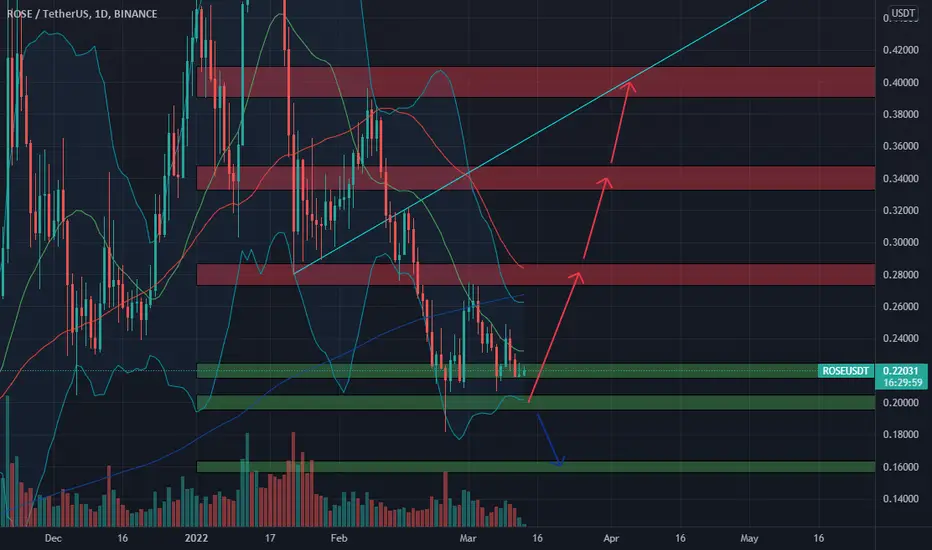
ROSE just closed the 1D candle with the Inverted Hammer pattern, which shows that the buying force has stopped the selling. However, ROSE can still correct to the $0.2 area before strongly increasing to the $0.4 area in the near future.
📈RED PLAN
♻️Condition : If 1-Day closes ABOVE 0.2$ zone
🔴Buy : 0.22 - 0.2
🔴Sell : 0.28 - 0.34 - 0.4
📉BLUE PLAN
♻️Condition : If 1-Day closes BELOW 0.2$ zone
🔵Sell : 0.2
🔵Buy : 0.16
❓Details
🚫Stoploss for Long : 10%
🚫Stoploss for Short : 5%
📈Red Arrow : Main Direction as RED PLAN
📉Blue Arrow : Back-Up Direction as BLUE PLAN
🟩Green zone : Support zone as BUY section
🟥Red zone : Resistance zone as SELL section
Disclaimer
The information and publications are not meant to be, and do not constitute, financial, investment, trading, or other types of advice or recommendations supplied or endorsed by TradingView. Read more in the Terms of Use.
Disclaimer
The information and publications are not meant to be, and do not constitute, financial, investment, trading, or other types of advice or recommendations supplied or endorsed by TradingView. Read more in the Terms of Use.