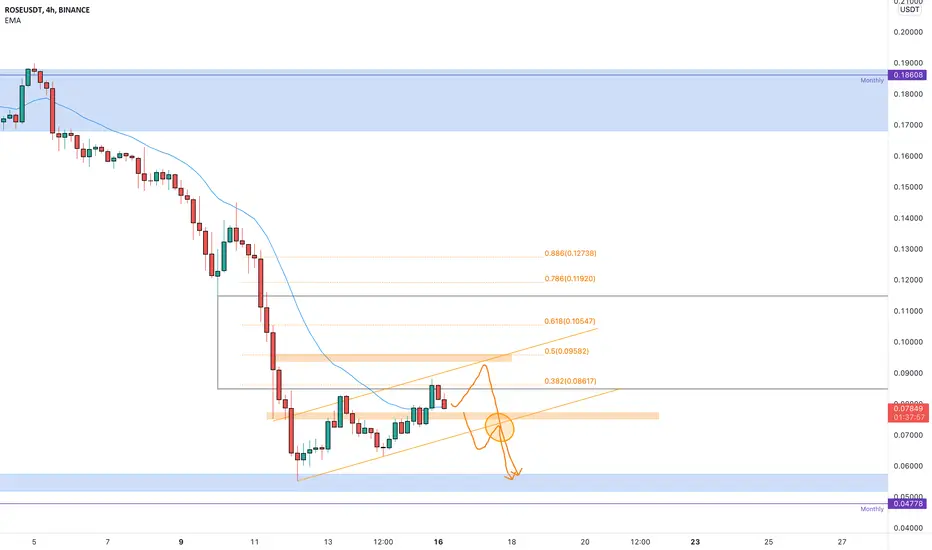
The price bounced on the daily support of 0.06$ after a big bearish impulse.
On the 4h timeframe, the price is testing the 0.382 Fibonacci level inside a bear flag
How to approach it?
The price could get new liquidity from 0.5 Fibonacci level and create a new bearish impulse. So, if the price is going to lose the bearflag and retest the support as new resistance we could see a double bottom on 0.06$
––––
Keep in mind.
🟣 Purple structure -> Monthly structure.
🔴 Red structure -> Weekly structure.
🔵 Blue structure -> Daily structure.
🟡 Yellow structure -> 4h structure.
Note
The price is testing the supportLet's see if the market is going to satisfy our rules for a new short position
Note
14% so far so good!Note
16% after my callNote
The price is creating equal lows above the demand zone.
We could see a new bearish movement in order to grab new liquidity on 0.055$
Note
17% so far and the price is going to grab new liquidity from 0.055$ as I Told you.Note
20% so farRelated publications
Disclaimer
The information and publications are not meant to be, and do not constitute, financial, investment, trading, or other types of advice or recommendations supplied or endorsed by TradingView. Read more in the Terms of Use.
Related publications
Disclaimer
The information and publications are not meant to be, and do not constitute, financial, investment, trading, or other types of advice or recommendations supplied or endorsed by TradingView. Read more in the Terms of Use.