The Russell 2000 index is recovering this week's losses
This week, the markets suffered a major crash, with many overextended waves.
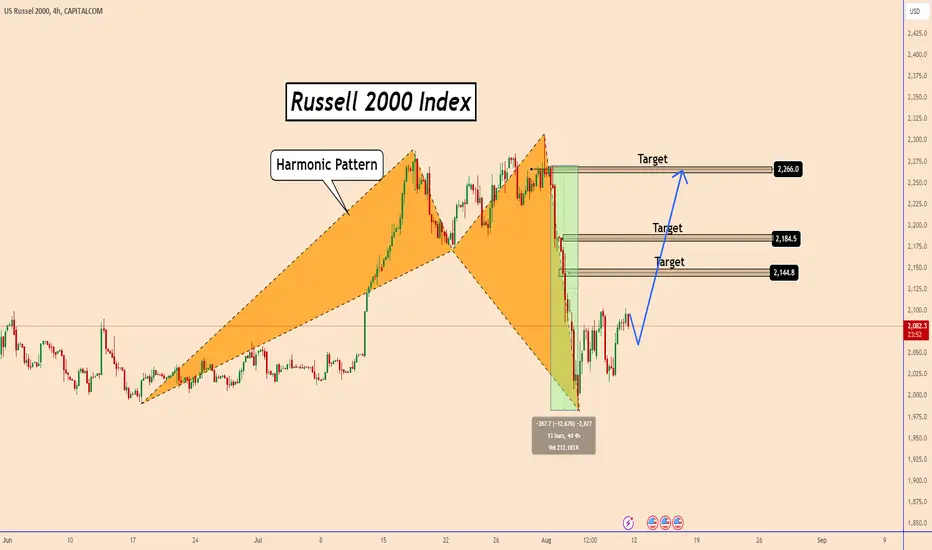
This is clearly shown in the RTY chart where the price dropped by nearly 12.50% in just 3 days.
It wasn't clear why it happened, but as we can see RTY completed a large and bullish harmonic pattern with overextended legs.
As long as the market calmed down, it seems like the perfect time for a correction.
The Russell 2000 is expected to test 2145, and 2185 during the coming week.
The last target near 2265 will take time.
You may find more details in the chart!
Thank you and Good Luck!
❤️PS: Please support with a like or comment if you find this analysis useful for your trading day❤️
This week, the markets suffered a major crash, with many overextended waves.
This is clearly shown in the RTY chart where the price dropped by nearly 12.50% in just 3 days.
It wasn't clear why it happened, but as we can see RTY completed a large and bullish harmonic pattern with overextended legs.
As long as the market calmed down, it seems like the perfect time for a correction.
The Russell 2000 is expected to test 2145, and 2185 during the coming week.
The last target near 2265 will take time.
You may find more details in the chart!
Thank you and Good Luck!
❤️PS: Please support with a like or comment if you find this analysis useful for your trading day❤️
Trade closed: target reached
✅MY Free Signals
t.me/TradingPuzzles
✅Personal Telegram
t.me/KlejdiCuni
✅YouTube
youtube.com/@TradingPuzzles
✅MY Recommended Broker is TRADE NATION
🔸bit.ly/49VySJF
t.me/TradingPuzzles
✅Personal Telegram
t.me/KlejdiCuni
✅YouTube
youtube.com/@TradingPuzzles
✅MY Recommended Broker is TRADE NATION
🔸bit.ly/49VySJF
Disclaimer
The information and publications are not meant to be, and do not constitute, financial, investment, trading, or other types of advice or recommendations supplied or endorsed by TradingView. Read more in the Terms of Use.