Testing/tracking elliot wave theory. Please do not trade off idea without S/L. Not financial advice.
Link to previous chart:
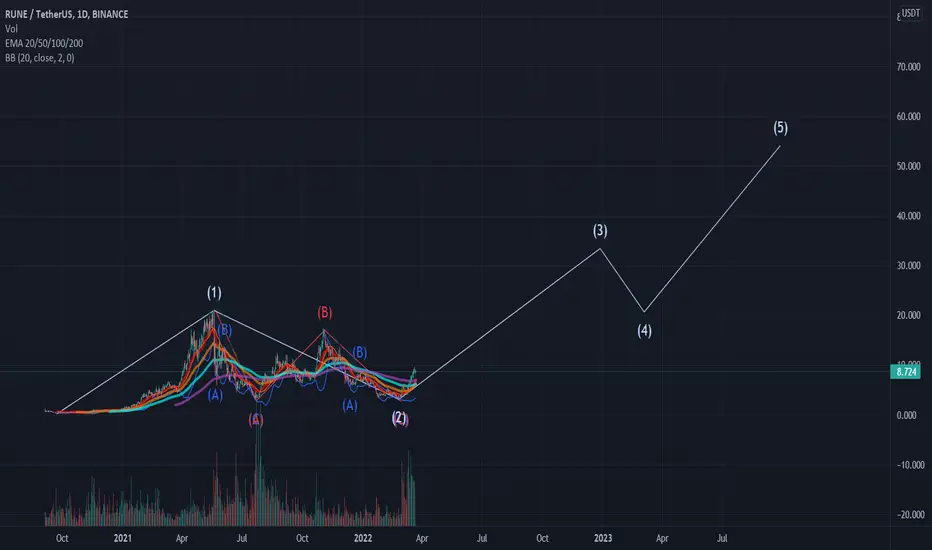
The chart looks similar to audio chart with a double three corrective wave. Currently we're below the .238 fib levels with a double bottom that played out. A lot of charts are looking similar to these and we're in accumulation zone. Either we resume up for the wave (3) impulse wave or we get another corrective wave. Everything depends on BTC's movement and a triple three corrective wave is still at play (appears more frequently in a bear market). Despite all of the crazy things that has been going on and cryptocurrency is still going strong, I don't think we will see a bear market anytime soon, at least another year up. BTC was at 3k in march 2020 so it's only normal that we pullback a little. 3k to 42k is 14x. 69k to 42k is a healthy 35% pullback. Anyways this is the wrong chart to talk about btc lol happy trading if you're using this chart.
Link to previous chart:
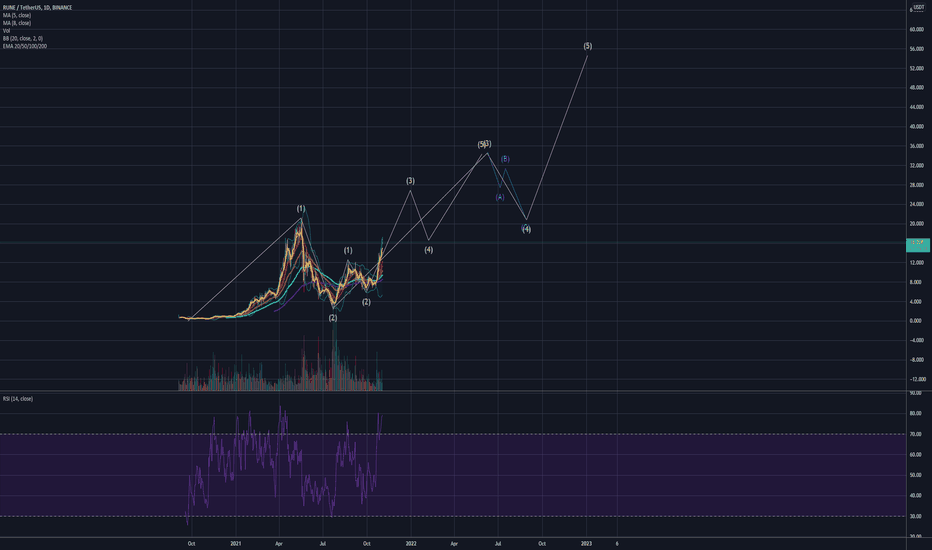
The chart looks similar to audio chart with a double three corrective wave. Currently we're below the .238 fib levels with a double bottom that played out. A lot of charts are looking similar to these and we're in accumulation zone. Either we resume up for the wave (3) impulse wave or we get another corrective wave. Everything depends on BTC's movement and a triple three corrective wave is still at play (appears more frequently in a bear market). Despite all of the crazy things that has been going on and cryptocurrency is still going strong, I don't think we will see a bear market anytime soon, at least another year up. BTC was at 3k in march 2020 so it's only normal that we pullback a little. 3k to 42k is 14x. 69k to 42k is a healthy 35% pullback. Anyways this is the wrong chart to talk about btc lol happy trading if you're using this chart.
Disclaimer
The information and publications are not meant to be, and do not constitute, financial, investment, trading, or other types of advice or recommendations supplied or endorsed by TradingView. Read more in the Terms of Use.
Disclaimer
The information and publications are not meant to be, and do not constitute, financial, investment, trading, or other types of advice or recommendations supplied or endorsed by TradingView. Read more in the Terms of Use.